August 21, 2024


Stay up to date on the latest real estate trends.

key biscayne
Lucas Boccheciampe | June 18, 2026
The shift is quiet but unmistakable. Affluent buyers from Latin America, Europe, and beyond are bypassing Brickell's towers, and setting their sights on a small island… Read more

Events
Lucas Boccheciampe | June 4, 2026
FIFA World Cup matches, Rosalía's arena tour opener, the 32nd Mango Festival, Wynwood Pride, Ocean Week, and 50+ more events, everything happening in Miami this June,… Read more
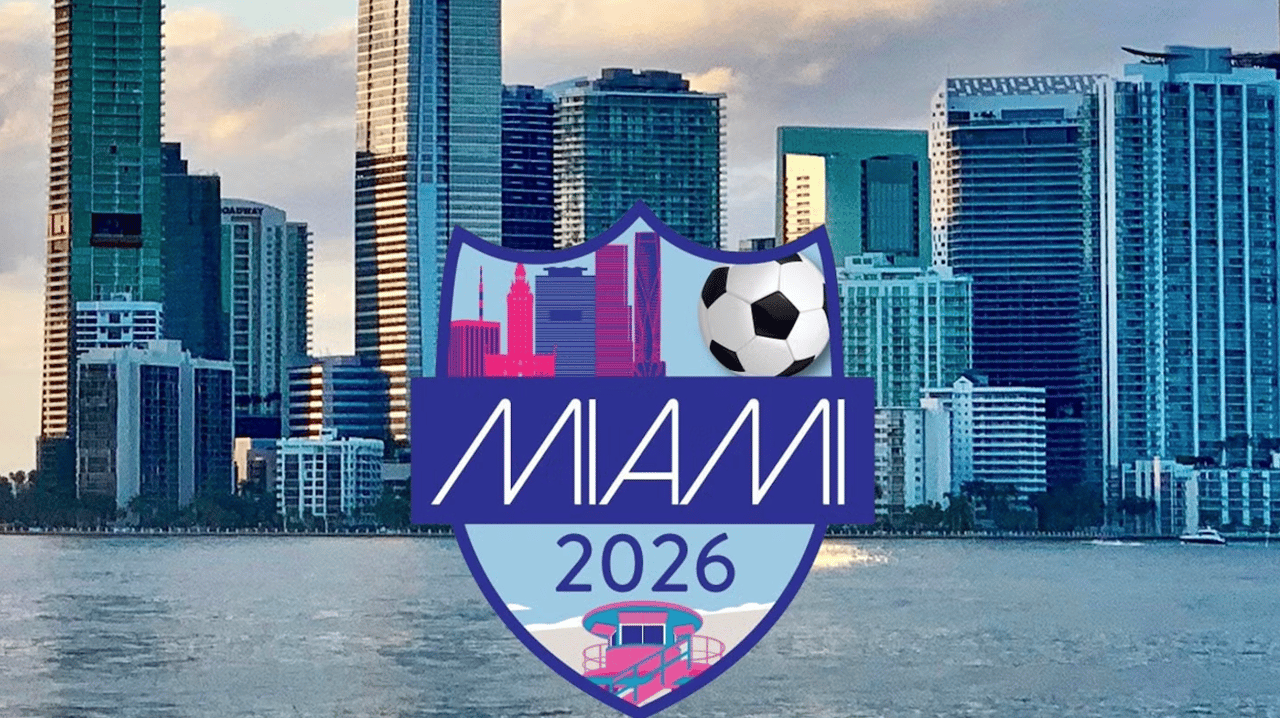
What to do in Miami
Lucas Boccheciampe | May 28, 2026
Everything you need to know about matches, the stadium, fan zones, top things to do, and the best places to stay in the Magic City this summer.

key biscayne
Lucas Boccheciampe | May 14, 2026
Expert Insights, Verified Market Data, and Proven Strategies for Buyers and Investors Aged 40 to 60

Miami
Lucas Boccheciampe | April 30, 2026
A Local’s Guide to Exploring Miami Like You Actually Live Here
key biscayne
Lucas Boccheciampe | April 30, 2026
Miami Housing Market 2026: Prices Drop or Buyer Opportunity?

Market Report
Lucas Boccheciampe | April 23, 2026
Is the Miami Real Estate Market 2026 cooling?

key biscayne
Lucas Boccheciampe | April 16, 2026
A guide to the best hidden neighborhoods in Miami for everyday living, not just visiting

realtor
Lucas Boccheciampe | April 9, 2026
Buy a Home in Key Biscayne: What to Look For + Expert Tips
You’ve got questions and we can’t wait to answer them.