The Fed met January 30th through 31st and decided to keep its benchmark rate at a range of 5.25% to 5.50%, which it’s held since July 2023. The Fed board members left the meeting with a hopeful tone, but the meeting results are somewhat disappointing to those pushing for rate cuts in March. The door for cuts is cracked open, but we now expect rate cuts to begin closer to summer rather than in spring. Fed chairman Powell’s rationale is reasonable: the current rate levels seem to be working, and if it’s not broken, don’t fix it. The Fed’s dual mandate is for stable prices (inflation ~2%) and low unemployment. Currently, inflation is dropping, and unemployment is low, at 3.7%. Recession fears have declined once again, and the soft landing — slowing the economy without recession — that the Fed intended seems to be unfolding. Powell was quick to say the Fed does not have a growth mandate, which is correct, so the risks of cutting rates early will likely outweigh the benefits of cutting in March. However, if inflation continues to fall, and economic indicators are still favorable, rate cuts will likely start mid-year.
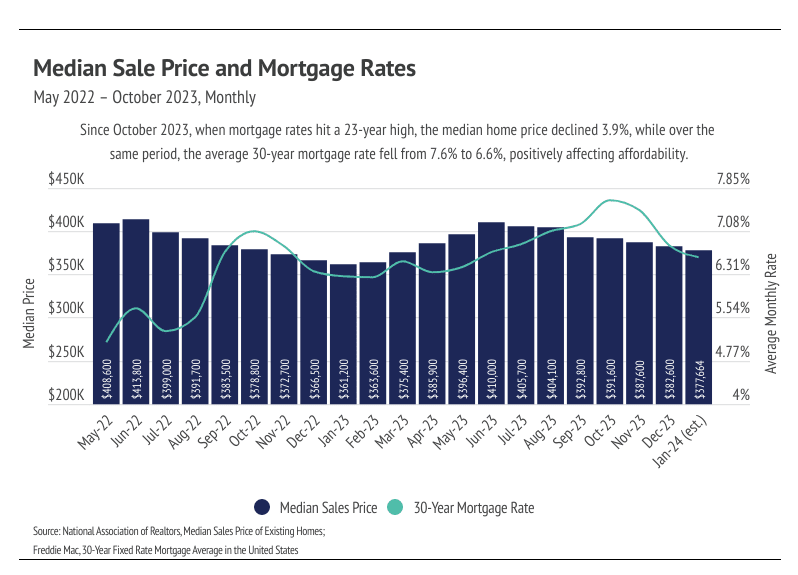
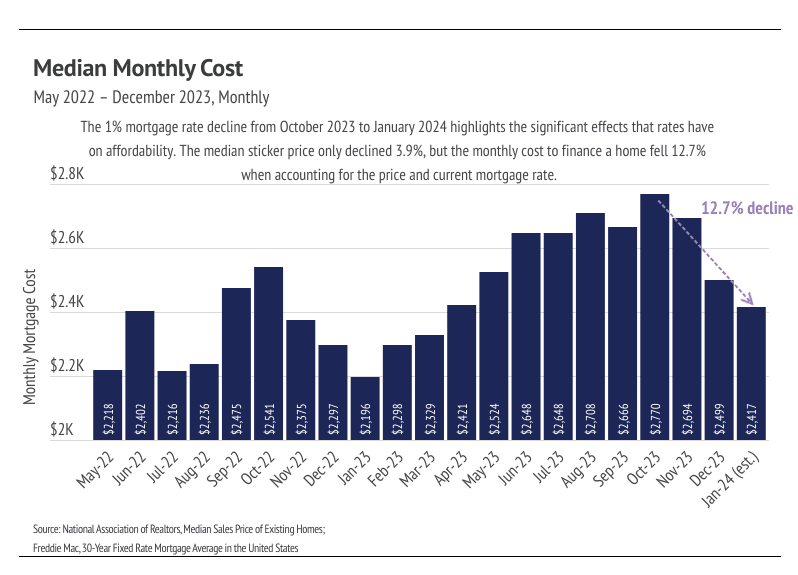
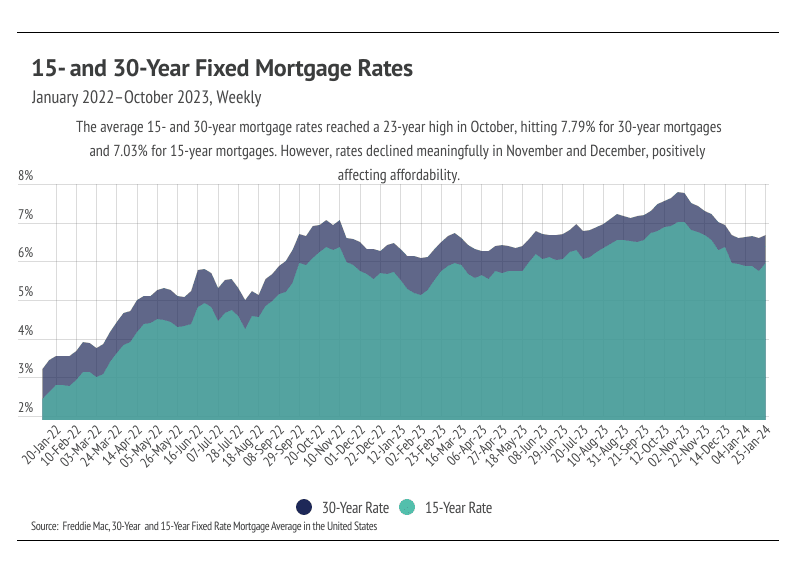
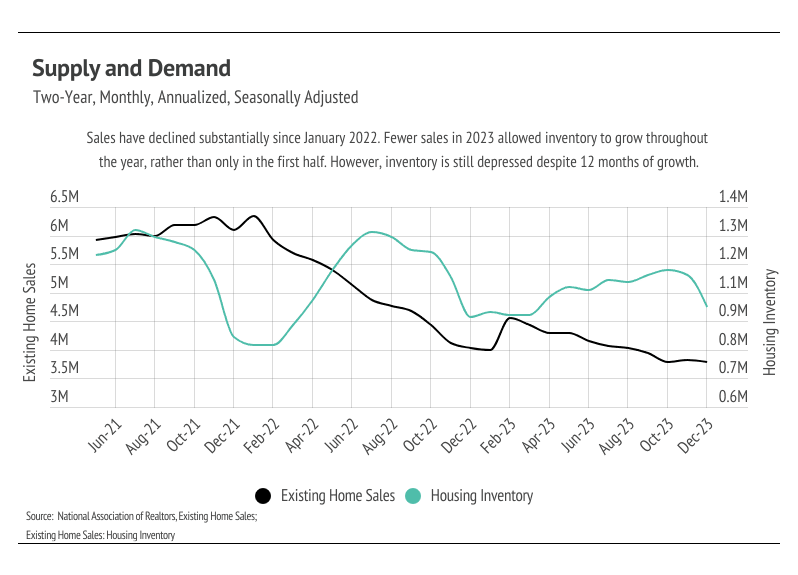
After the sharp mortgage rate drop in November and December 2023, the housing market saw real potential to warm considerably in Q1 2024, but now we expect a slower route to a healthier market. Mortgage rates remained steady at around 6.5% in January 2024, which is still about 1% higher than needed to get more participants to enter the housing market. We know the large mortgage rate drop from the 23-year high of 7.79% in October to around 6.5% wasn’t large enough to bring buyers and sellers back to the market, because the data now show that they didn’t come back. Sales reached a historic low, the number of new listings coming to market are near all-time lows, and inventory declined. This is due, in part, to normal seasonal trends — winter is when all those metrics tend to reach a seasonal bottom — but seasonality doesn’t fully explain those drops in the context of a substantial decline in rates. From October 2023 to January 2024, the monthly cost of financing a median priced home decreased nearly 13%, and the market still slowed on both the buyer and seller sides of the market, implying that rates are still too high for most would-be participants. However, we believe that if rates fall another percentage point, which roughly equates to another 10% decrease in monthly financing costs, the market will react positively and price more people into the housing market.
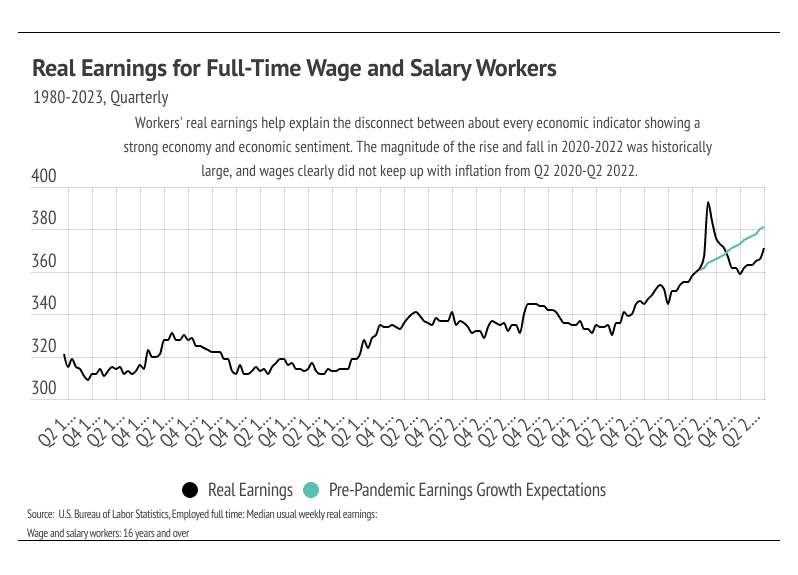
Another important aspect of the current market is the very recent positive changes in workers’ real earnings. The psychological effects of nearly 10 years of earnings growth, culminating in a final jump in the first two quarters of 2020, before dropping rapidly once COVID hit and inflation rose, was perhaps the most significant cause of the low economic sentiment in 2022 and most of 2023. People quickly become attached to the amount of money they make and the spending power of that money, so the feeling that it was taken away creates dissatisfaction. It’s also fair to say that part of the American dream is progressively increasing earnings as we age. But earnings didn’t keep up with inflation, so real earnings dropped, causing even more dissatisfaction. From 2021 to 2023, the purchasing power of the U.S. dollar declined 15%; therefore, earnings needed to increase 15% just to feel as financially well off as three years prior. For many, if not most people, earnings weren’t keeping up with inflation, and people don’t tend to buy homes when they feel less wealthy. However, after six straight quarters of real earnings growth, it makes sense that people broadly feel better about their finances, which will only benefit the housing market.
Different regions and individual houses vary from the broad national trends, so we’ve included a Local Lowdown below to provide you with in-depth coverage for your area. In general, higher-priced regions (the West and Northeast) have been hit harder by mortgage rate hikes than less expensive markets (the South and Midwest) because of the absolute dollar cost of the rate hikes and limited ability to build new homes. As always, we will continue to monitor the housing and economic markets to best guide you in buying or selling your home.
Big Story Data
The Local Lowdown — Miami-Dade, Broward, and Orange
-
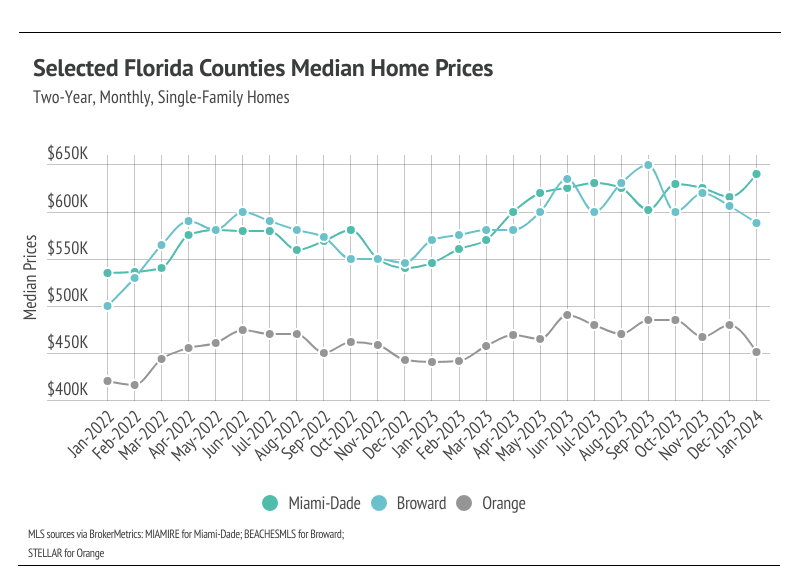
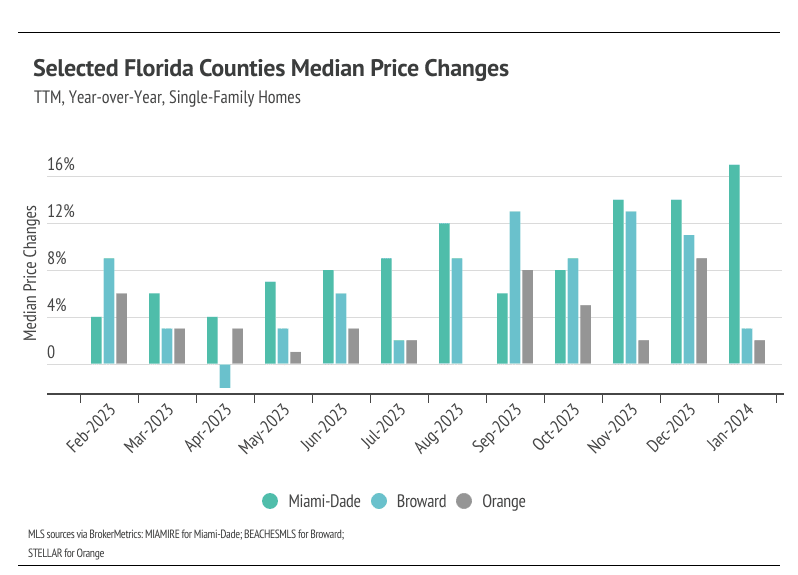
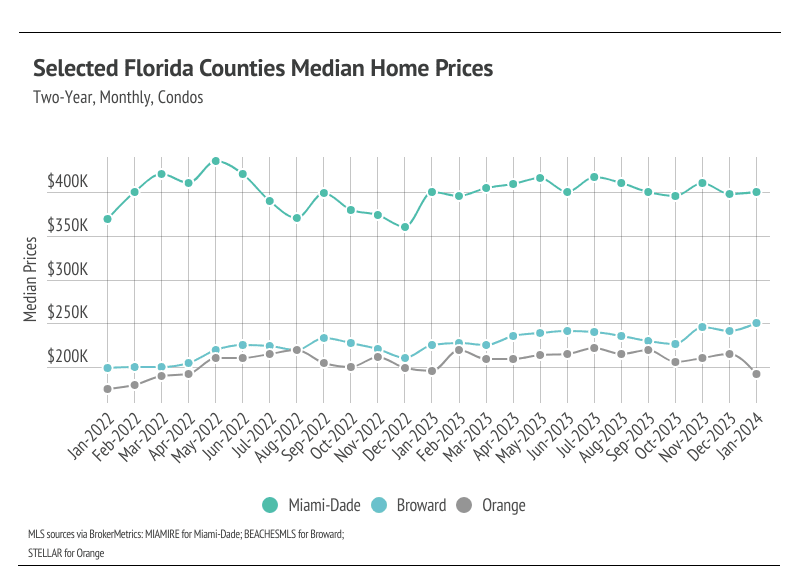
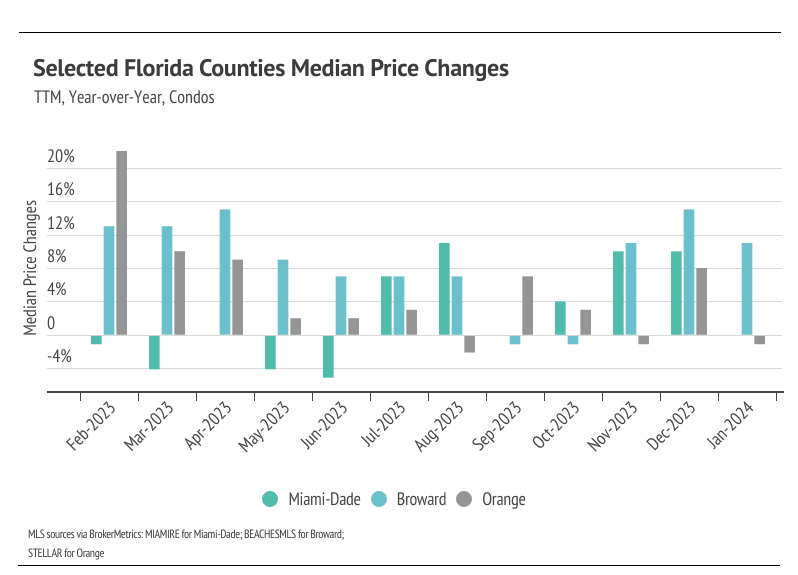
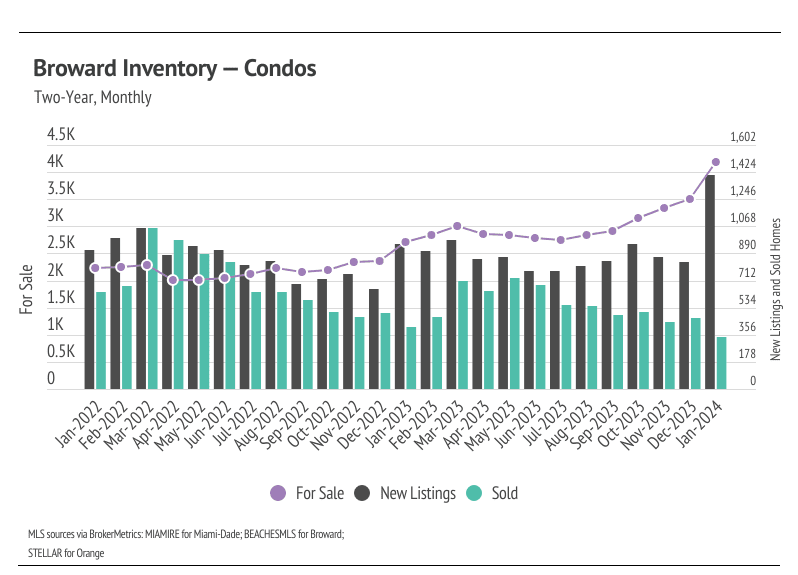
The median single-family home prices rose across the selected markets, even reaching a new record high in Miami-Dade. Broward condo prices also hit an all-time high in January.
-
Active listings rose 9% month over month, as new listings increased 57% from December 2023 to January 2024. Higher supply only benefits the Florida housing markets.
-
Months of Supply Inventory rose but failed to account for the homes coming under contract. The selected Florida markets still favor sellers despite rising MSI.
Note: You can find the charts/graphs for the Local Lowdown at the end of this section.
Median single-family home price in Miami-Dade and median condo price in Broward hit all-time highs
In Florida, home prices haven’t been largely affected by rising mortgage rates — even recently reaching all-time highs during a period of rapidly rising mortgage rates. In January, the median single-family home price in Miami-Dade and the median condo price in Broward hit all-time highs. Prices almost never peak in the winter months, indicating home prices will likely rise to a new high in almost every month in the first half of the year. Slight price contractions are normal and expected in the second half of any given year. We expect prices to remain slightly below peak in the rest of the selected counties in the winter months, but as interest rates decline, prices will almost certainly reach new highs in the first half of 2024. Additionally, the low but rising inventory and new listings will only raise prices as demand grows. More homes must come to the market in the spring and summer to get anything close to a healthy market, and we are already seeing more new listings come to the market.
High mortgage rates soften both supply and demand, so ideally, as rates fall, far more sellers will come to the market. Rising demand can only do so much for the market if there isn’t supply to meet it. Unlike 2023 inventory, 2024 inventory has a much better chance of following more typical seasonal patterns.
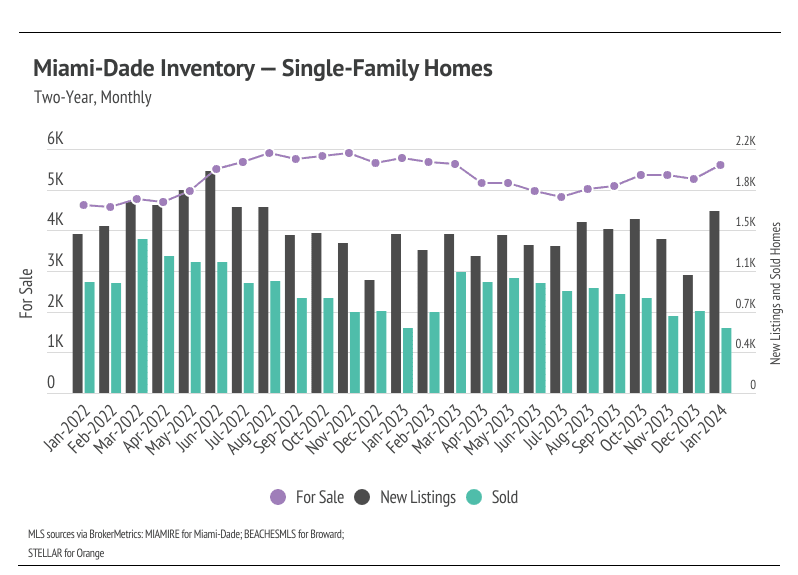
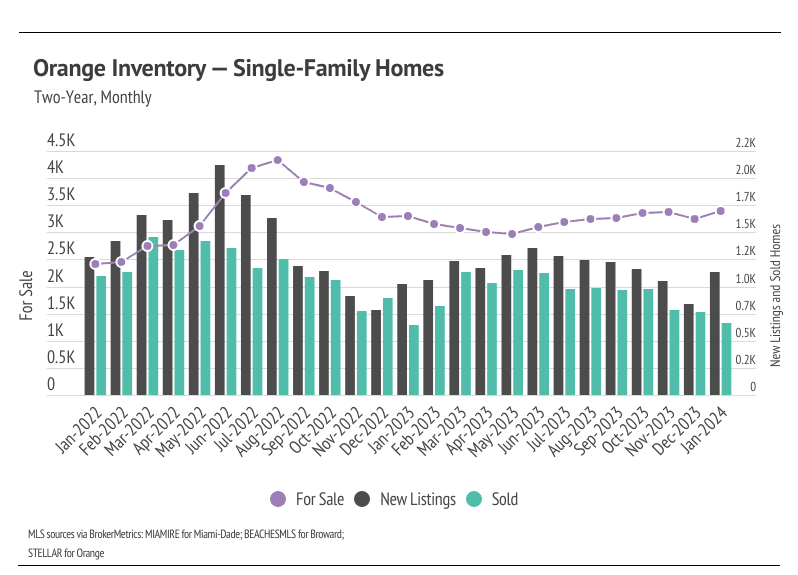
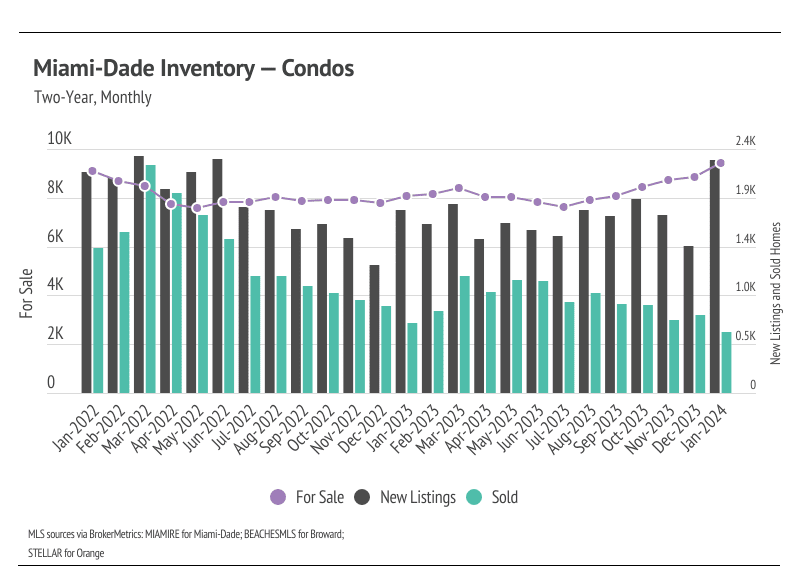
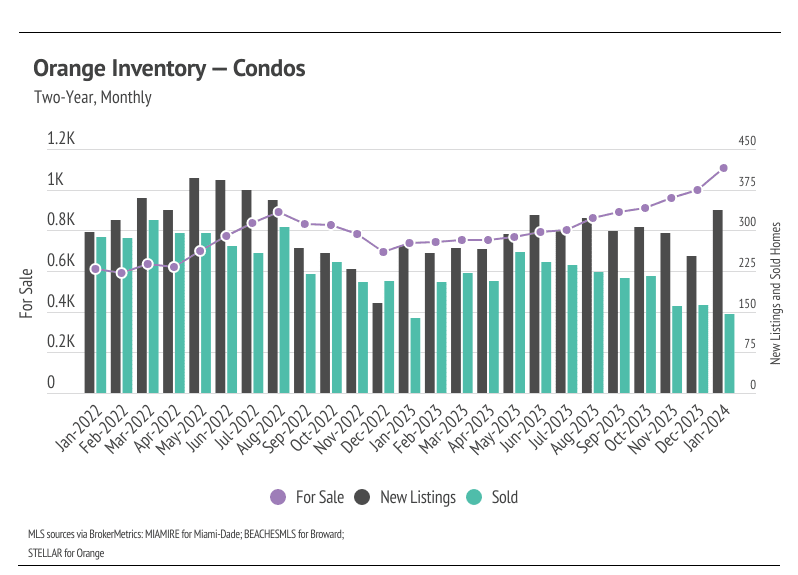
New listings rose significantly along with inventory in January 2024
Single-family home and condo inventory and new listings rose from December 2023 to January 2024. In 2023, inventory patterns didn’t resemble the typical seasonal inventory wave, but 2024 is already showing signs of a more normal year. Typically, inventory peaks in July or August and declines through December or January. Single-family home inventory has barely increased at all in the past year, which highlights the desirability of the selected markets. However, more new condo listings have been coming to the market, causing condo inventory to increase to a two-year high across markets. New listings rose 57% month over month, and the number of new listings coming to market is a significant predictor of sales. Month over month, homes coming under contract increased 38%. Year over year, inventory and new listings are up 15% and 26%, respectively; however, sales are down 4%.
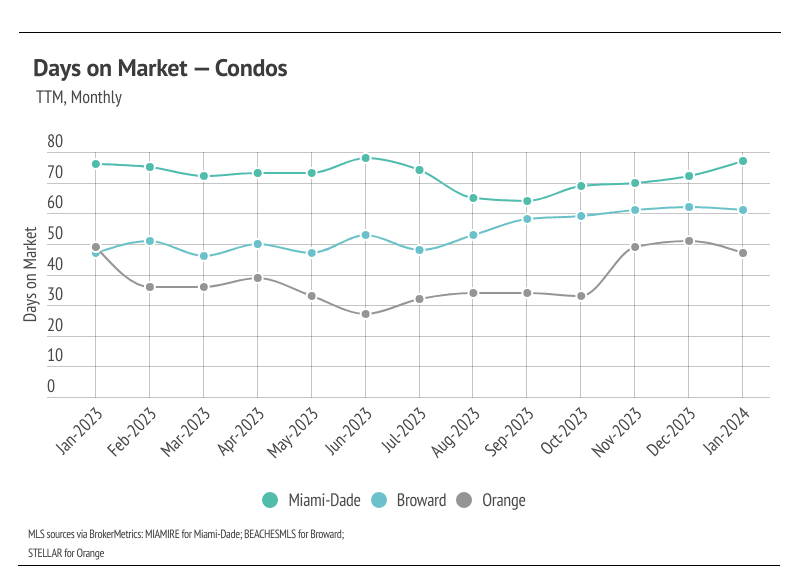
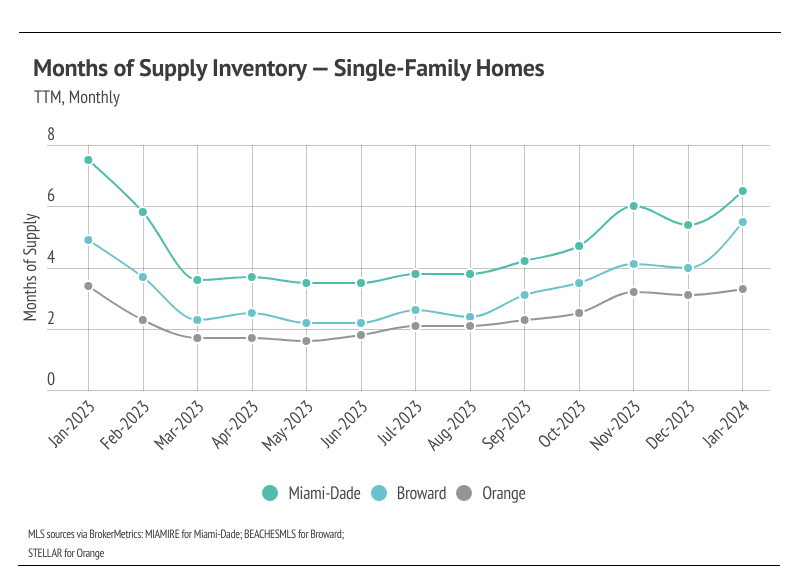
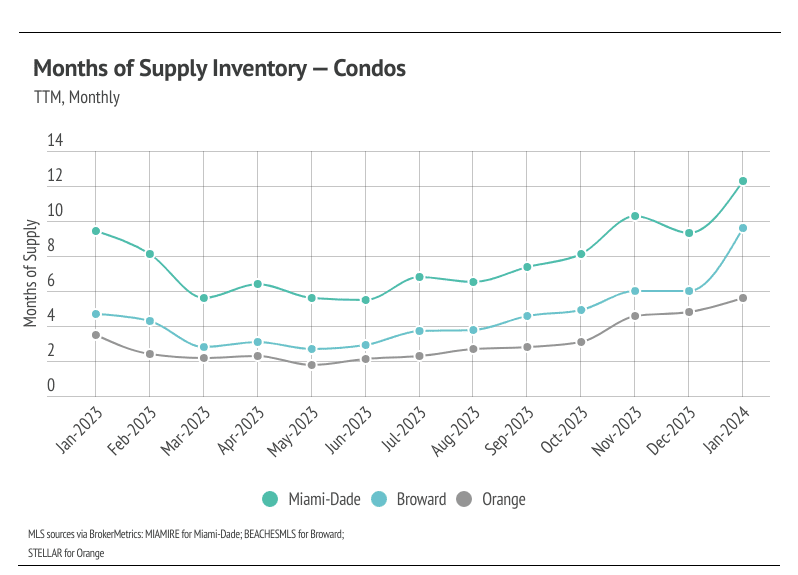
Months of Supply Inventory doesn’t tell an accurate picture this month
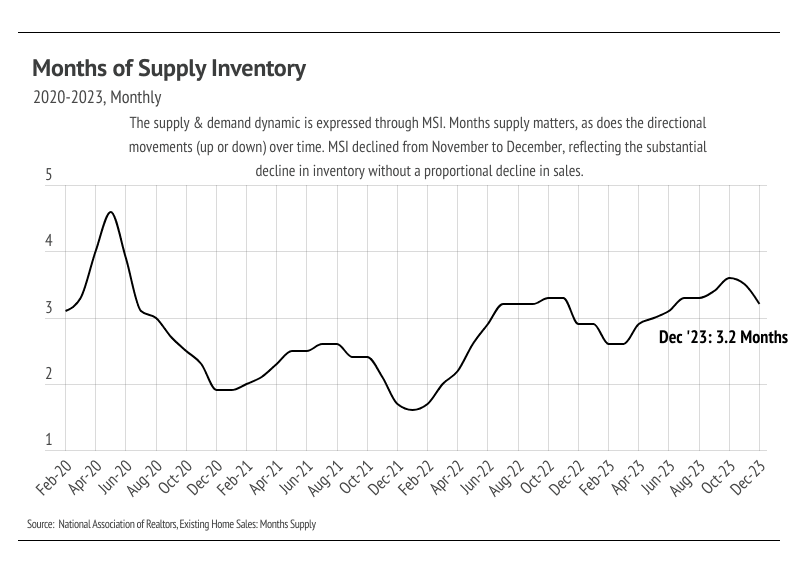
Months of Supply Inventory (MSI) quantifies the supply/demand relationship by measuring how many months it would take for all current homes listed on the market to sell at the current rate of sales. The long-term average MSI is around four to five months in Florida, which indicates a balanced market. An MSI lower than four indicates that there are more buyers than sellers on the market (meaning it’s a sellers’ market), while an MSI higher than five indicates there are more sellers than buyers (meaning it’s a buyers’ market). MSI rose significantly in the second half of 2023, largely due to the decline in sales and longer time on the market, and continued to rise in January 2024. However, January is unusual in that new listings jumped higher across the selected areas, which caused inventory to rapidly rise month over month and increase the proportion of active listings to sales. However, next month we will see a correction when the January homes under contract become official sales in February. In short, the selected Florida markets still favor sellers.
We can also use percent of list price received as another indicator for supply and demand. Typically, in a calendar year, sellers receive the lowest percentage of list price during the winter months, when demand is lowest. January tends to have the lowest average sale price (SP) to list price (LP), and the summer months tend to have the highest SP/LP. The January 2024 SP/LP was higher than last year, meaning we expect sellers overall to receive a higher percentage of the list price throughout all of 2024 than they did in 2023.