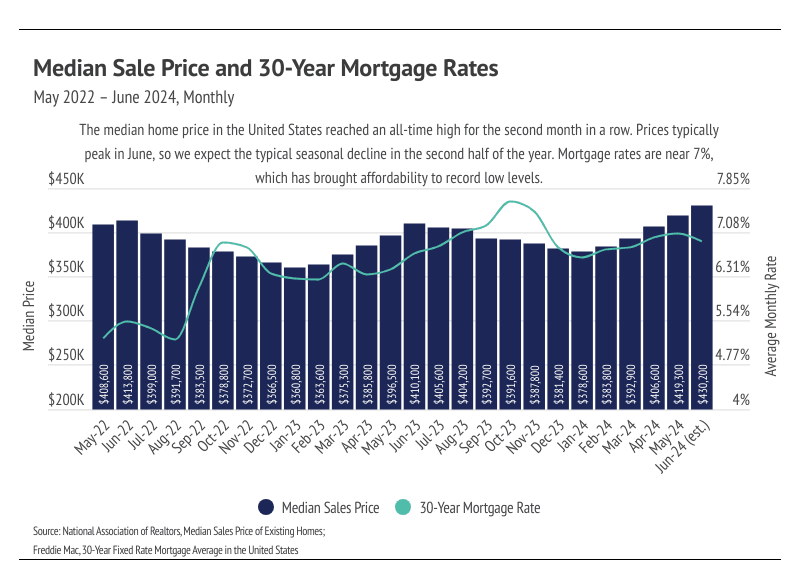
In June, prices rose for the fifth month in a row, peaking at an all-time high in June 2024. This also marks the 12th consecutive month of year-over-year price growth. According to typical seasonality, the median price peaks in June, so we expect prices to decline starting in July. Over time, prices generally move much higher in the first half of the year than they decline in the second half; you can think of it as two steps forward and one step back, year after year. Last year, for example, prices rose 13.7% from January 2023 to June 2023, then fell 7.7% from June 2024 to January 2024, which was still a year-over-year gain of 4.9%. This year will likely look similar, although we don’t think that prices will decline as much in the second half of 2024 as they did in 2023, especially if the Fed cuts rates in the fall. Even a minor rate cut, like the expected 0.25%, could significantly affect mortgage rates, as it would signal the beginning of more and more cuts.
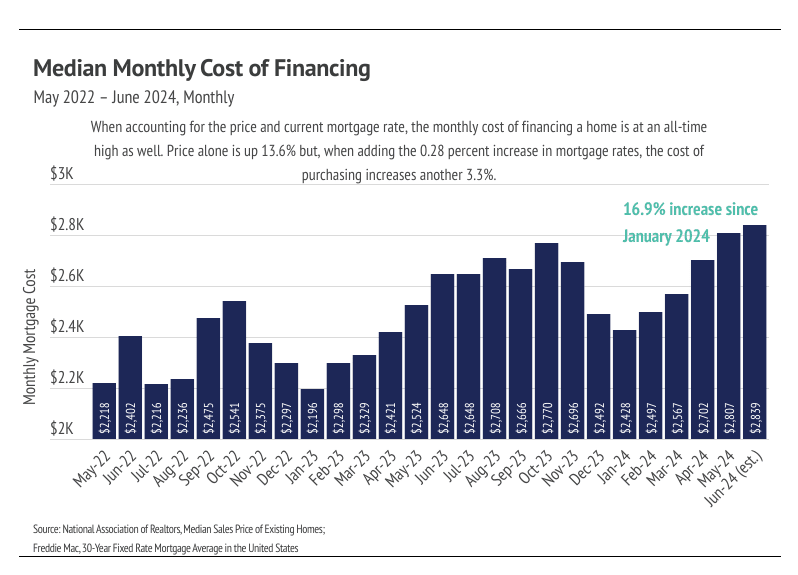
For the moment though, we are starting summer with a combination of elevated mortgage rates and record high prices, which have brought affordability to an all-time low. Low affordability has resulted in fewer sales and growing inventory. Demand is still high relative to supply, even though inventory is building. We know that demand is still high because buyers are still buying at peak prices. From a historical context, we should’ve expected this to happen. We took a look at data from the 1980s to see how much home prices appreciated during a decade-long period of the highest mortgage rates in history. From January 1, 1980, to January 1, 1990, the 30-year mortgage rate ranged from 9.03% to 18.63%, with an average rate of 12.71%. Although home prices didn’t increase dramatically like they have in the recent past, inflation-adjusted home prices still increased about 8% during that decade. Today, with the strong U.S. economy, it was never very likely for home prices to stagnate or decline due to higher mortgage rates. However, high rates have slowed sales volume considerably, which has caused inventory to grow.
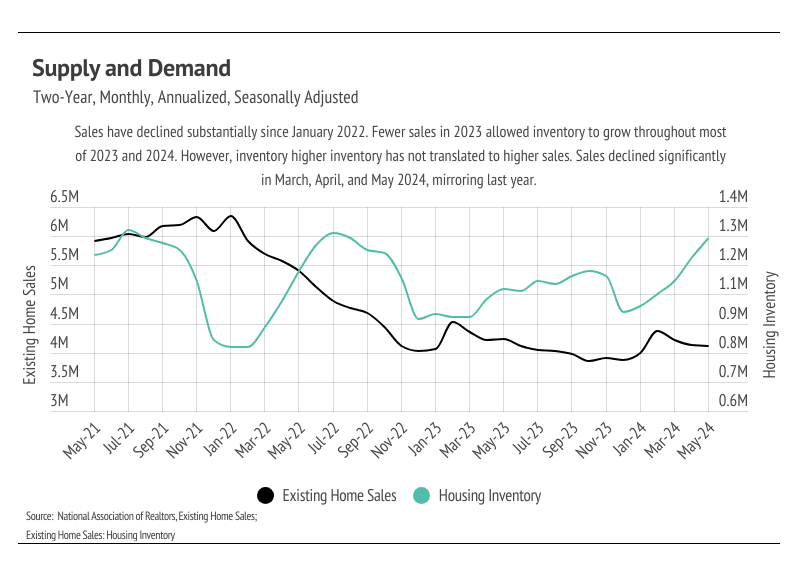
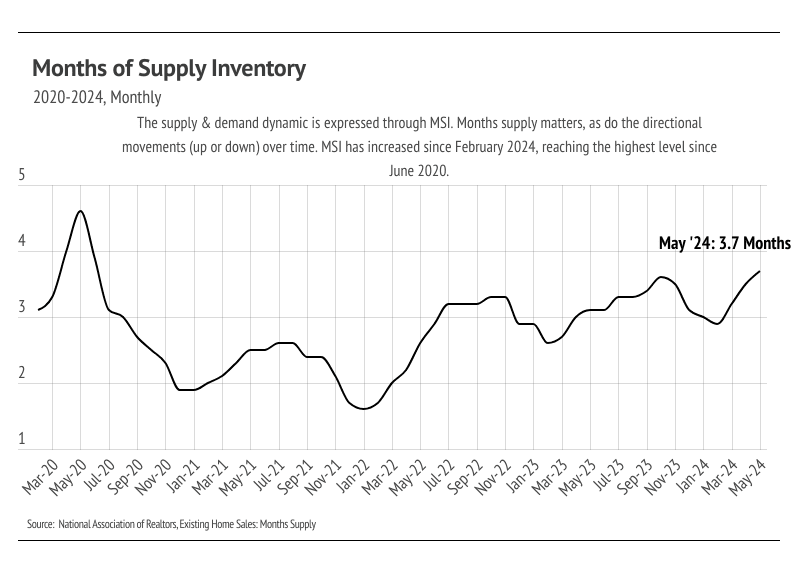
Overall, inventory growth is great news for the undersupplied U.S. housing market. According to data from the National Association of REALTORS® (NAR), inventory reached its highest level since August 2022. The market is still broadly undersupplied, but the increasing inventory level should cause rising home prices to slow. In the pre-pandemic seasonal trends, sales, new listings, inventory, and price would roughly all rise in the first half of the year and decline in the second half of the year. Sales and new listings have been far lower than usual since mortgage rates started climbing, which is to be expected. Because we don’t anticipate sales to pick up until the spring of 2025, inventory could continue to grow in the second half of the year.
Different regions and individual houses vary from the broad national trends, so we’ve included a Local Lowdown below to provide you with in-depth coverage for your area. As always, we will continue to monitor the housing and economic markets to best guide you in buying or selling your home.
Big Story Data
The Local Lowdown — Miami-Dade, Broward, and Orange
-
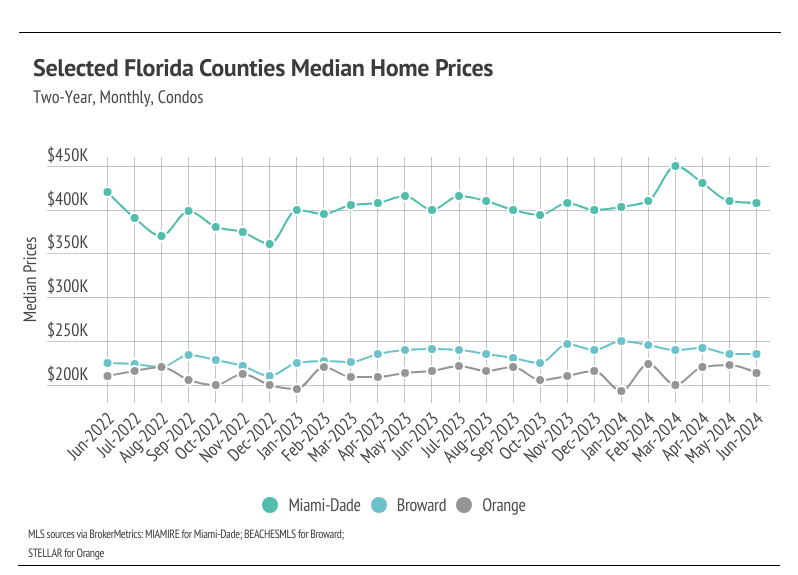
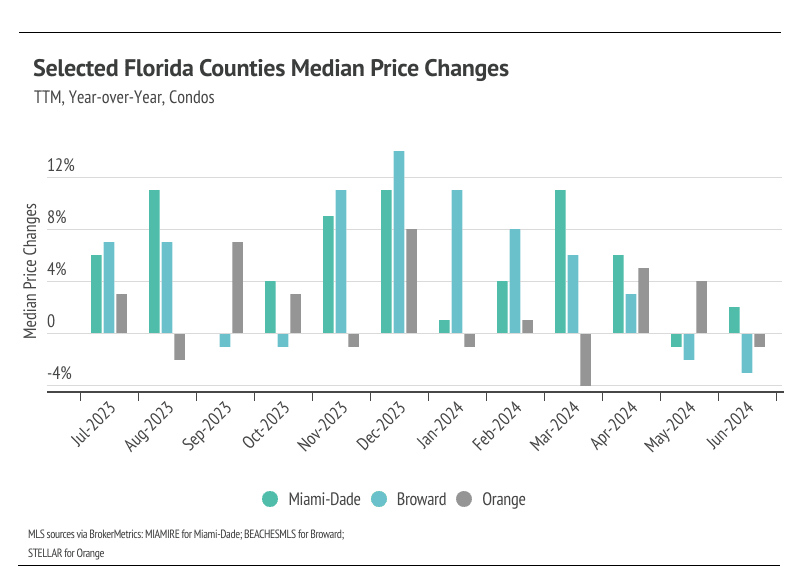
Single-family home prices in Miami-Dade, Broward, and Orange counties reached all-time highs. Condos are near record highs in the selected markets as well, and we expect new highs next month.
-
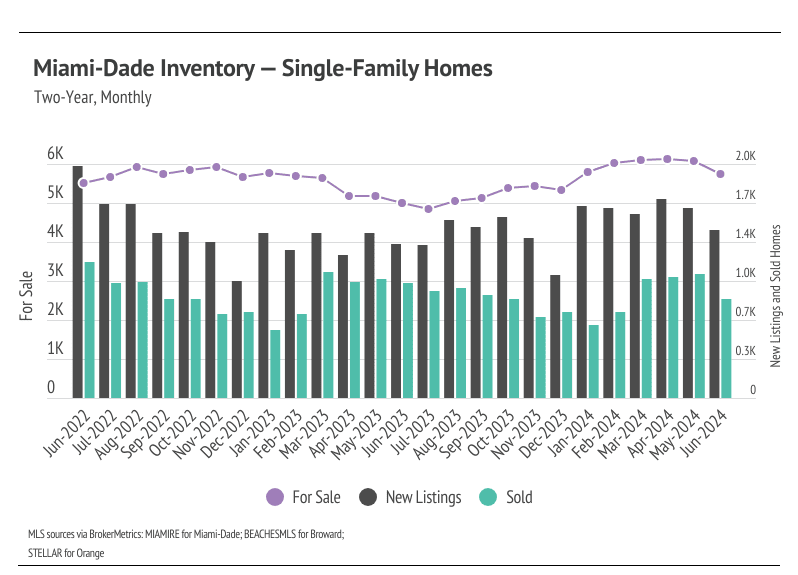
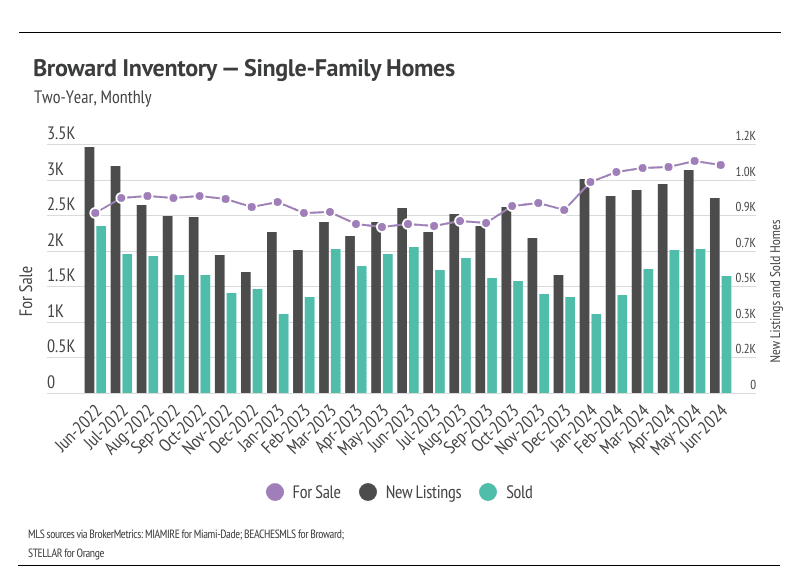
Active listings have risen significantly for single-family homes and condos in 2024. The market is also seeing more new listings and more sales, which are both good for a healthier market.
-
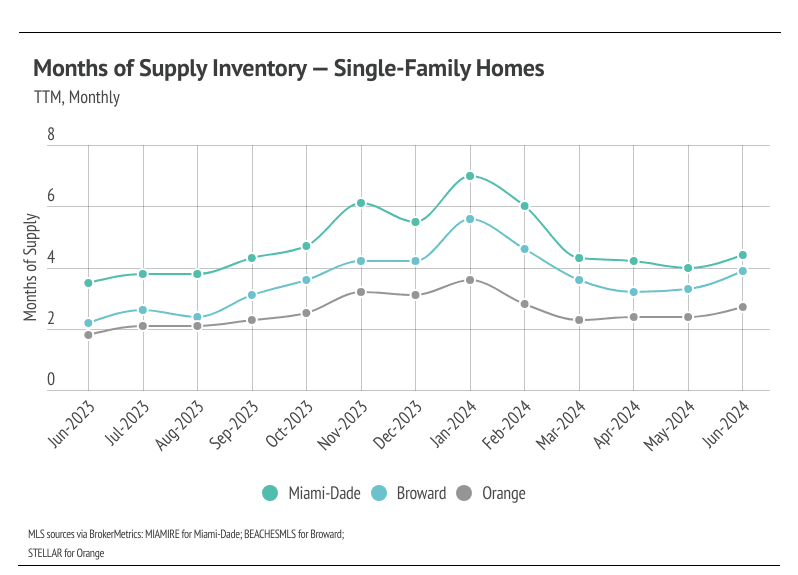
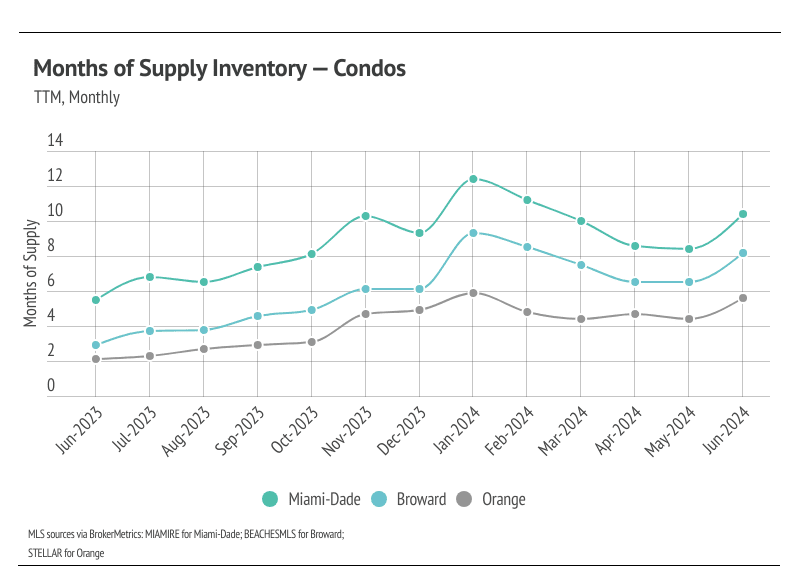
Months of Supply Inventory rose across markets in June. Currently, for single-family homes, MSI indicates the selected markets favor sellers, while condo MSI shows a buyer’s market.
Note: You can find the charts/graphs for the Local Lowdown at the end of this section.
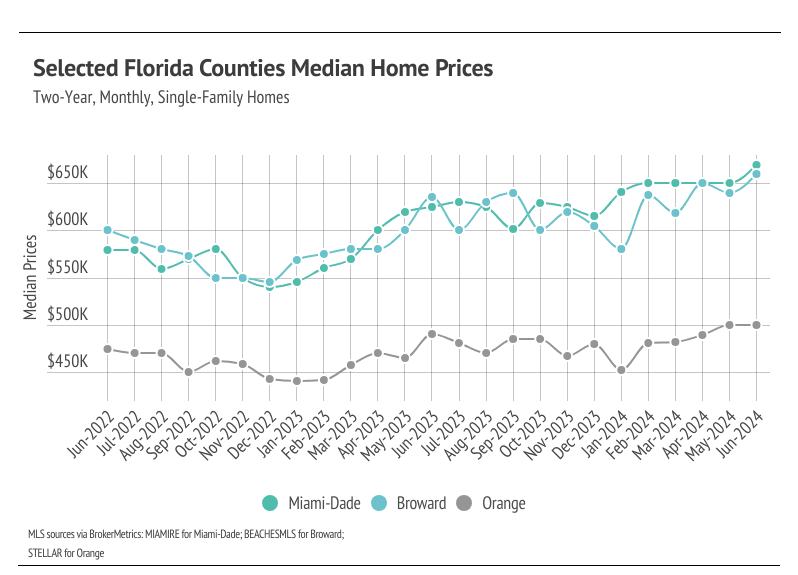
Median single-family home prices in Miami-Dade, Broward, and Orange hit all-time highs in June
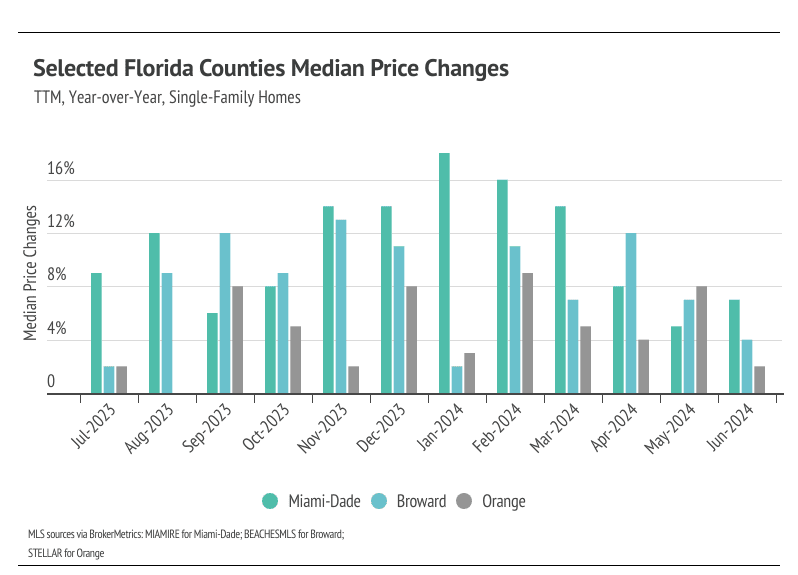
In Florida, home prices haven’t been largely affected by rising mortgage rates — even reaching all-time highs during a period of high mortgage rates. In February, the median single-family home prices in Miami-Dade and Broward, and the median condo price in Orange, all hit all-time highs. In March, Miami-Dade single-family home and condo prices continued that trend, reaching new all-time highs again. Single-family home prices in Miami-Dade and Broward reached record highs in April. Miami-Dade single-family homes hit a record high again in May, as did Orange single-family homes. Then, in June, single-family home prices hit new record highs across markets. Prices have truly highlighted the demand in these markets.
Florida has been an interesting case study recently, where residents are starting to move because home insurance prices have risen, which has brought more listings to the market. However, demand is still incredibly strong, so the rising inventory and new listings have only raised prices as demand has grown.
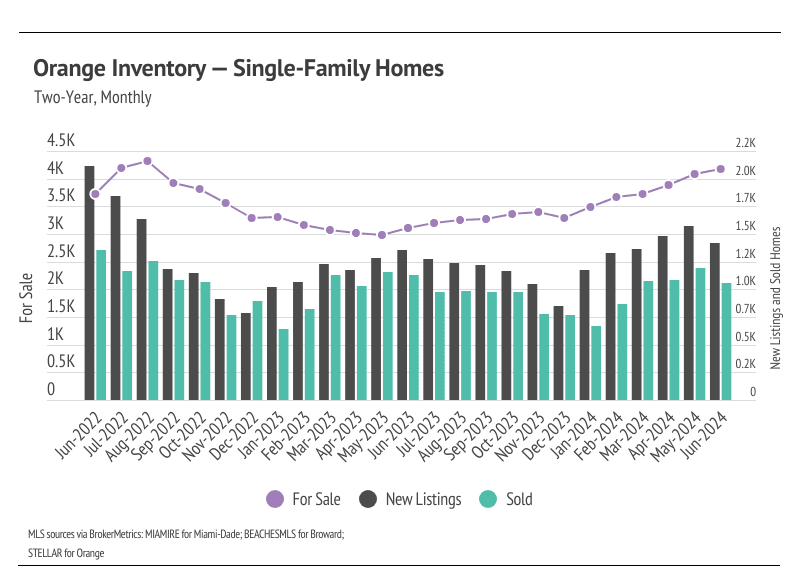
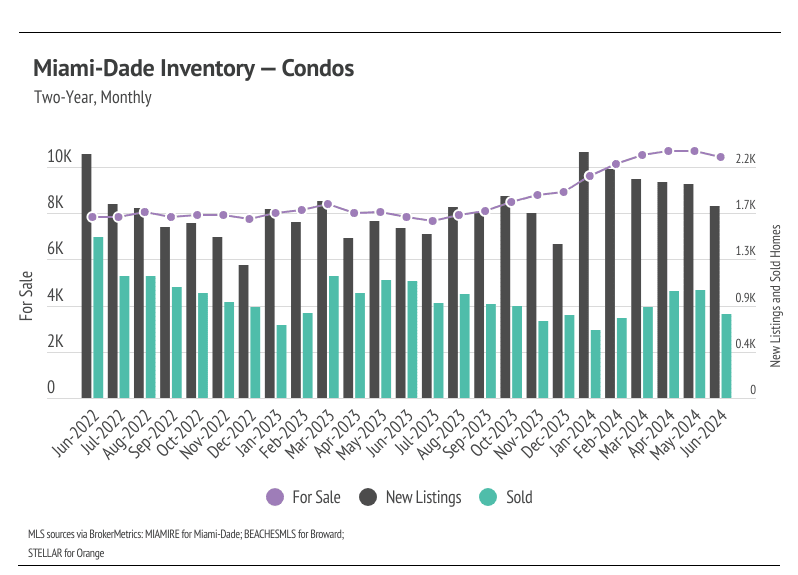
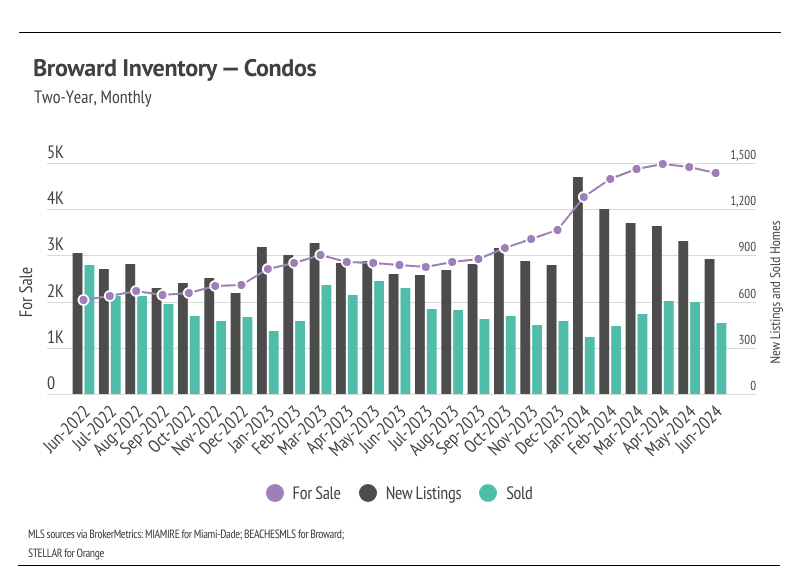
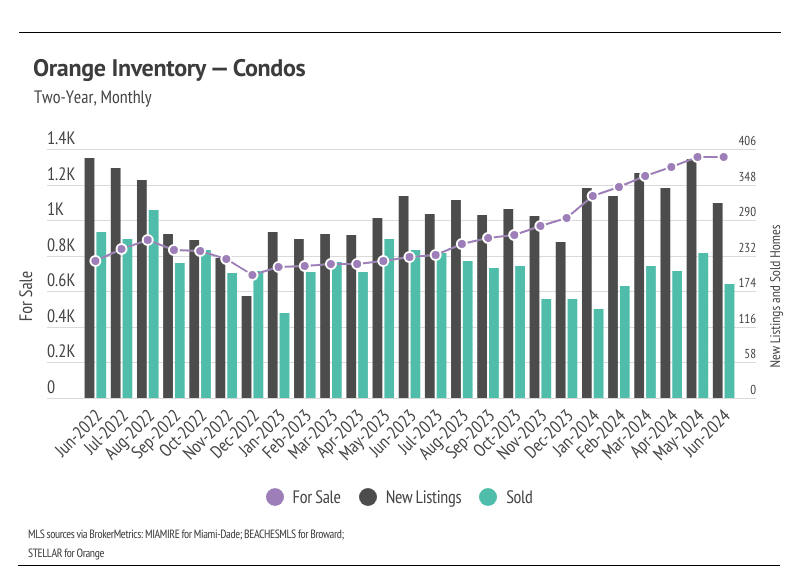
Inventory levels reached a two-year high in the selected Florida markets for single-family homes and condos
Florida inventory patterns have been atypical since the pandemic started. Homebuyers flocked to Florida, dropping inventory to hyper-low levels. Only recently has inventory begun to build. Low inventory and new listings, coupled with high mortgage rates, led to a substantial drop in sales and a generally slower housing market from June 2022 to the present. Typically, inventory begins to increase in January or February, peaking in July or August before declining once again from the summer months to the winter. In 2023, inventory patterns didn’t resemble the typical seasonal inventory wave. Luckily, inventory has grown substantially in 2024 — especially for condos. The number of new listings coming to market is a significant predictor of sales, and the increase in new listings over the past few months has led to an increase in sales. In June, new listings declined, as did sales, so inventory will begin to contract in the coming months.
In terms of supply and demand metrics, in 2024, the selected markets aren’t trending similarly. Miami-Dade supply is showing signs that inventory will be tight for the rest of the year, and sales are slowing. Broward inventory is strong, but sales are also starting to slow. In Orange, inventory is still growing.
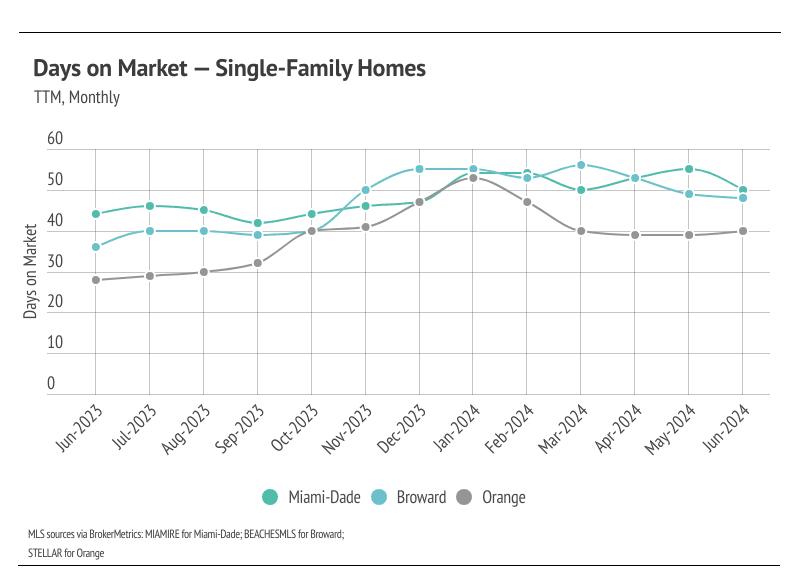
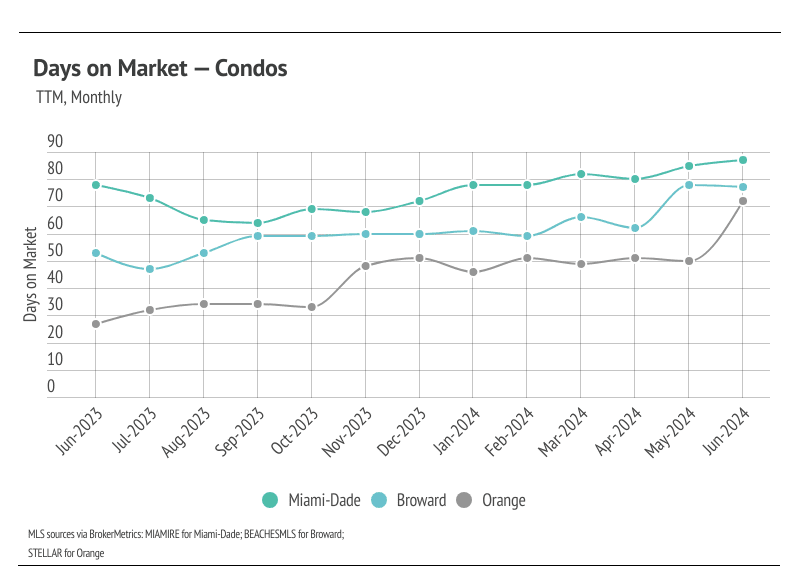
Months of Supply Inventory rose in June after the sharp decline from January to May 2024
Months of Supply Inventory (MSI) quantifies the supply/demand relationship by measuring how many months it would take for all current homes listed on the market to sell at the current rate of sales. The long-term average MSI is around four to five months in Florida, which indicates a balanced market. An MSI lower than four indicates that there are more buyers than sellers on the market (meaning it’s a sellers’ market), while an MSI higher than five indicates there are more sellers than buyers (meaning it’s a buyers’ market). MSI rose significantly in the second half of 2023, largely due to the decline in sales and longer time on the market, and continued to rise in January 2024. However, January is unusual in that new listings jumped higher across the selected areas, which caused inventory to rise rapidly month over month and increased the proportion of active listings to sales. As expected, in February and March, MSI corrected and declined meaningfully across markets and continued to fall in April and May. In June, however, MSI rose for single-family homes and condos across the selected markets. Currently, MSI indicates a sellers’ market for single-family homes, and for condos, MSI indicates buyers’ markets.