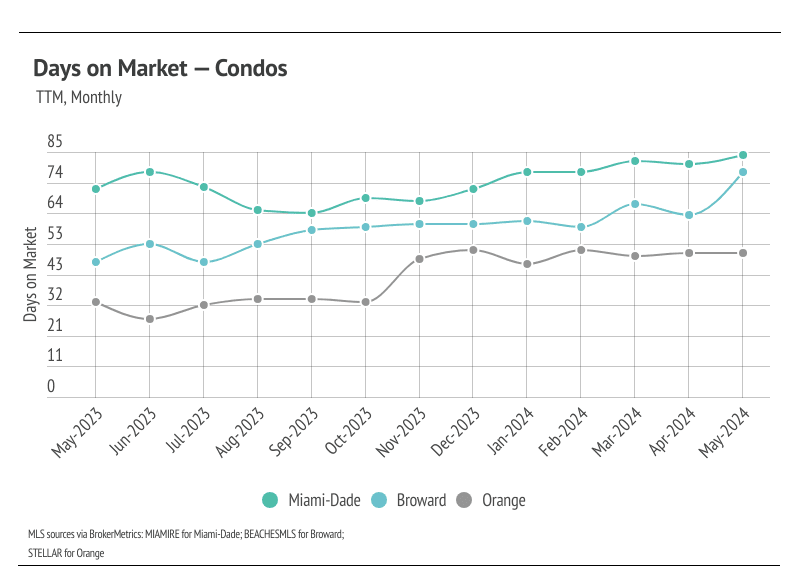
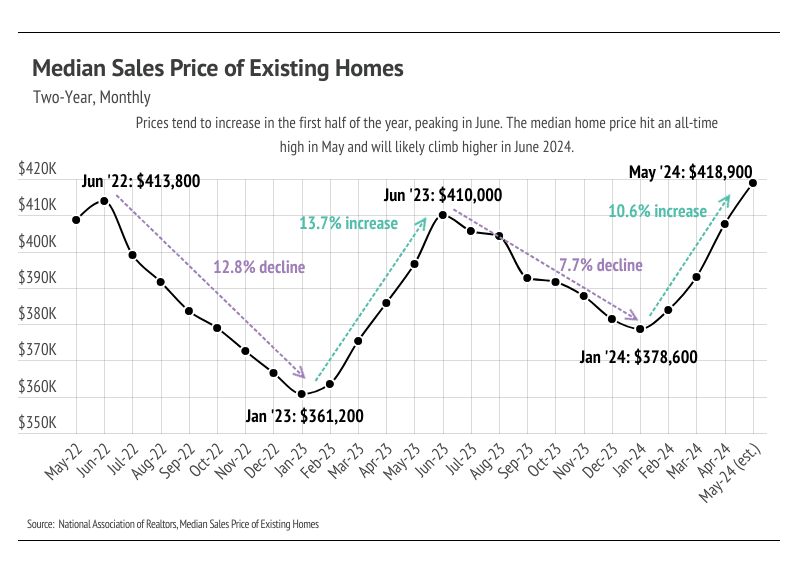
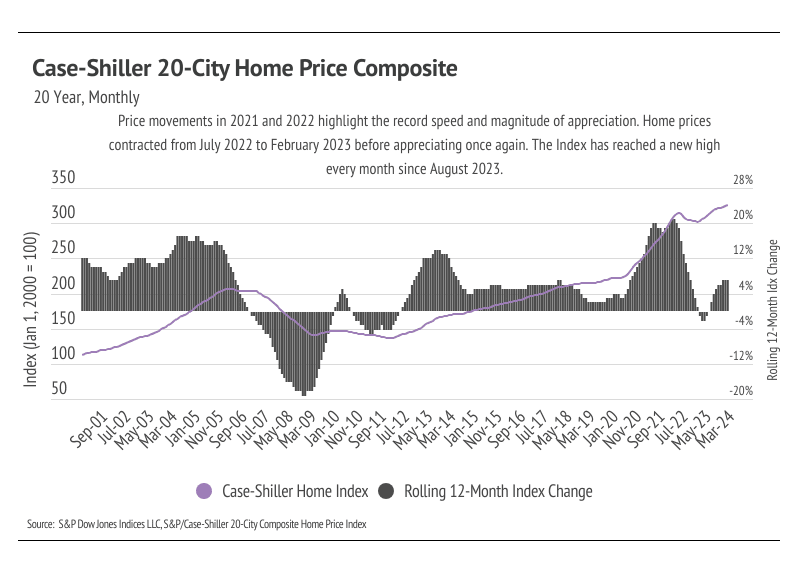
According to the National Association of Realtors® (NAR), the median sales price for existing homes grew 5.6% to $418,900 between May 2023 and the present — the eleventh consecutive month of year-over-year price growth, and the highest median price ever reached. Typically, the median price peaks in June each year, so we will likely see prices climb even higher when the data comes in for this month. In addition to NAR, the Case-Shiller 20-City Composite Home Price Index, which measures the aggregate price level of homes in the largest 20 metropolitan statistical areas, has reached a new high for the eighth month in a row. The combination of elevated mortgage rates and rising prices has brought affordability to an all-time low, which translates to fewer sales and growing inventory. However, at the same time, homes are spending less and less time on the market.
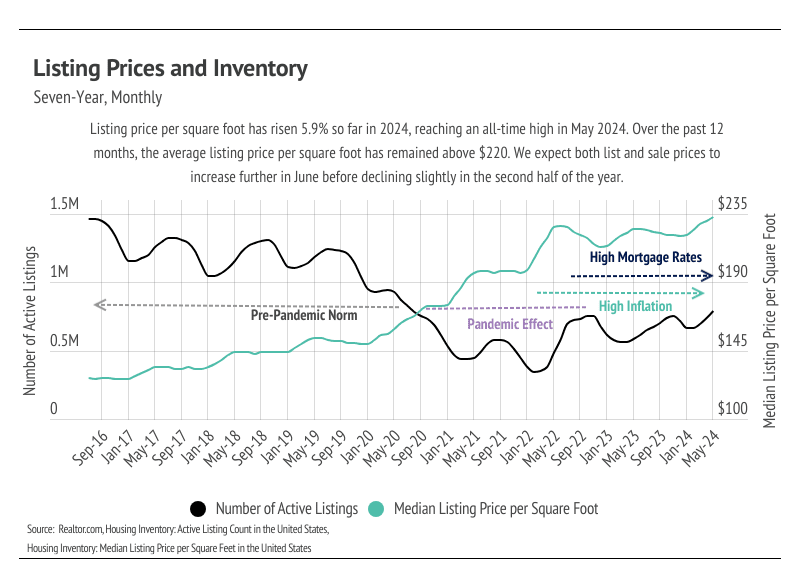
Demand is still high relative to supply, even though inventory is building. The buyers that haven’t been priced out of the market are moving quickly on homes that suit them. Despite the high demand and quick market, there are simply fewer buyers in the market. Higher mortgage rates can only lead to fewer market participants. On the bright side, inventory growth is great news for the wildly undersupplied U.S. housing market. According to data from realtor.com, inventory reached its highest level since August 2020. The market is still broadly undersupplied, but the increasing inventory level should cause rising home prices to slow. Decreasing home prices mid-year is also normal on a seasonal basis. In the pre-pandemic seasonal trends, sales, new listings, inventory, and price would roughly all rise in the first half of the year and decline slightly in the second half of the year. Sales and new listings have been far lower than usual since mortgage rates started climbing, which is to be expected.
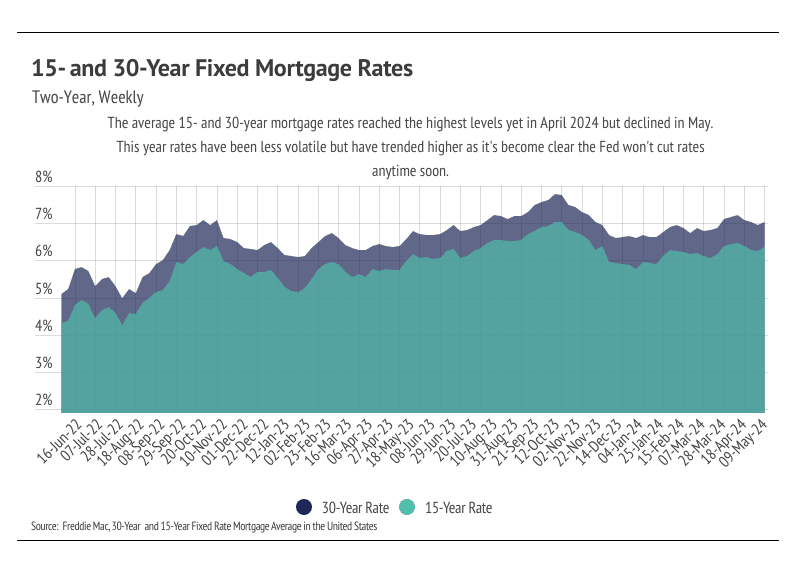
The average 30-year mortgage rate began the year at 6.62% and landed at 7.03% at the end of May, marking the third year mortgage rates have been elevated. At the start of the year, rate expectations were far different from those today. In January, inflation still appeared to be trending lower, and economists were predicting rate cuts as early as March. However, in hindsight, inflation stopped trending lower in June 2023 and has held fairly steady around 3.3% since then. The Fed targets an inflation rate of 2%, so we aren’t expecting rate cuts anytime soon. In fact, the safest bet may be to not expect any rate cuts in 2024. The Fed’s dual mandate aims for stable prices (inflation ~2%) and low unemployment, so it’s all about inflation, especially because the job market is still strong.
During the Fed’s May meeting, the Federal Reserve Board unanimously voted to hold policy rates steady for the sixth consecutive time, leaving the federal funds target rate unchanged at 5.25% to 5.50%. Although this letter was written before the June 11-12 Fed meeting, we are confident the Fed will hold rates steady. If there’s a silver lining, it’s that even though rate cuts are extremely unlikely, rate hikes are even less probable.
Different regions and individual houses vary from the broad national trends, so we’ve included a Local Lowdown below to provide you with in-depth coverage for your area. As always, we will continue to monitor the housing and economic markets to best guide you in buying or selling your home.
Big Story Data
The Local Lowdown
-
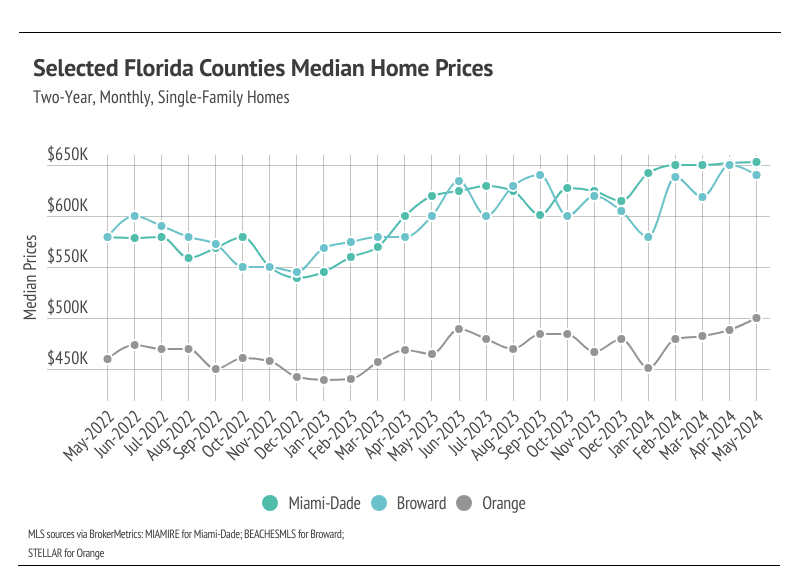
Single-family home prices in Miami-Dade and Orange counties rose month over month, reaching new all-time highs. Prices are at or near record highs in the selected markets, and we expect new highs across markets within the next few months.
-
Active listings have risen significantly for single-family homes and condos in 2024. The market is also seeing more new listings and more sales, which are both good for a healthier market.
-
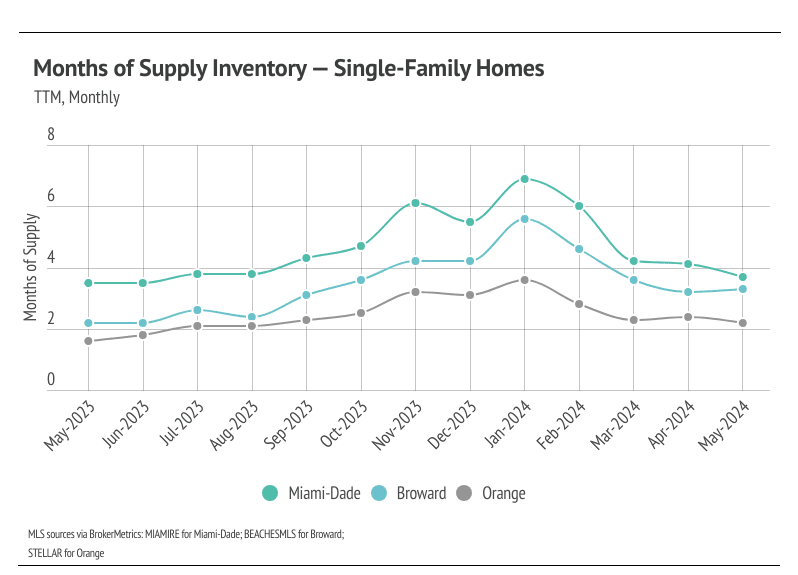
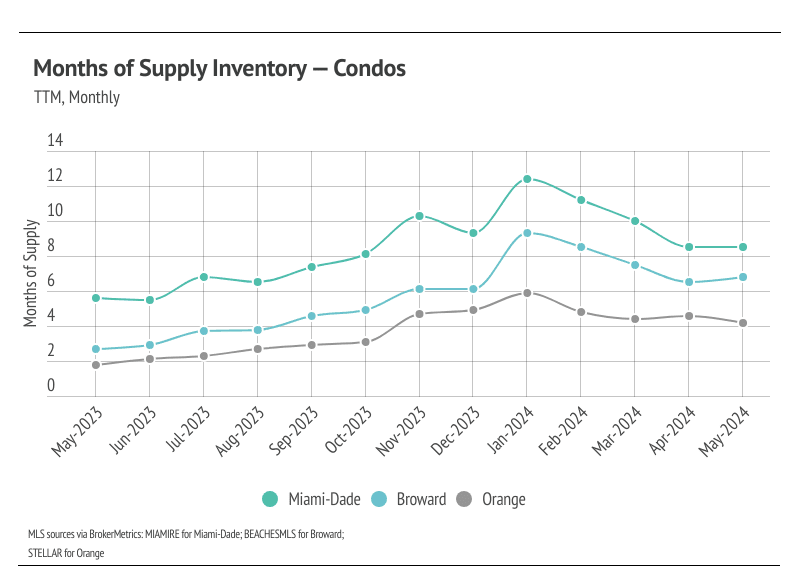
Months of Supply Inventory dropped across markets since January. Currently, for single-family homes, MSI indicates the selected markets favor sellers. For condos, MSI indicates a balanced market in Orange and a buyers’ market in Miami-Dade and Broward.
Note: You can find the charts/graphs for the Local Lowdown at the end of this section.
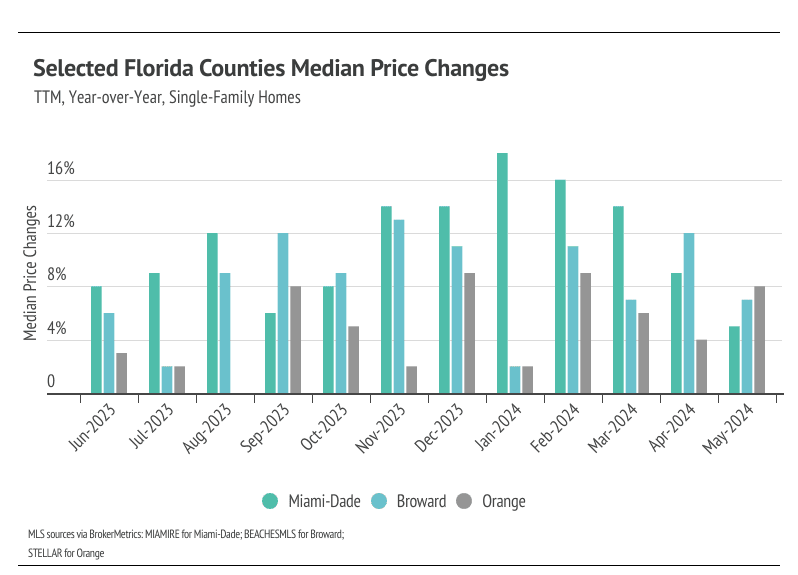
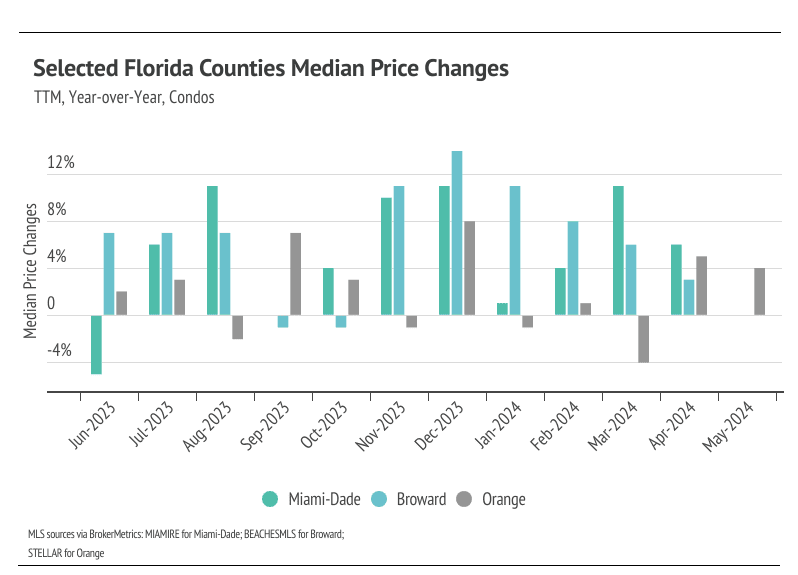
Median single-family home prices in Miami-Dade and Orange hit all-time highs in May
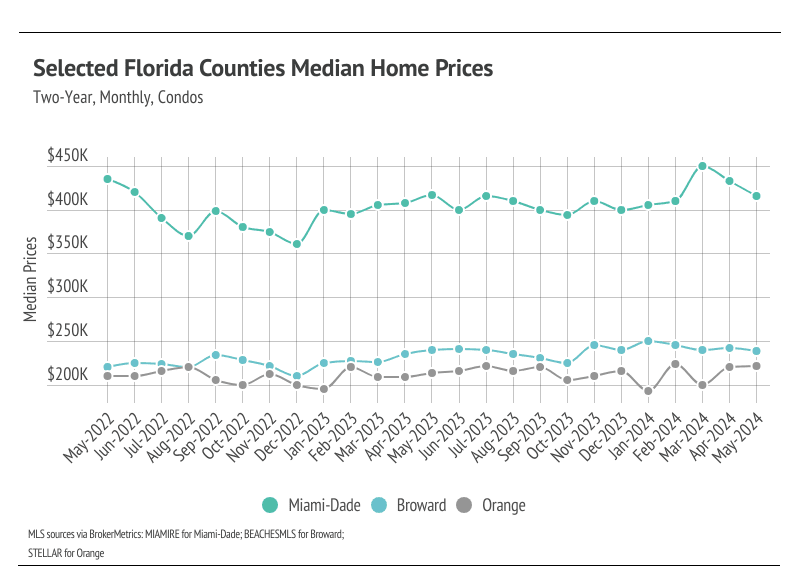
In Florida, home prices haven’t been largely affected by rising mortgage rates — even recently reaching all-time highs during a period of rapidly rising mortgage rates. In February, the median single-family home prices in Miami-Dade and Broward, and the median condo price in Orange, all hit all-time highs. In March, Miami-Dade single-family home and condo prices continued that trend, reaching new all-time highs again. Single-family home prices in Miami-Dade and Broward reached record highs in April. Miami-Dade single-family homes hit a record high again in May, as did Orange single-family homes.
Prices almost never peak so early in a year, highlighting the demand in these markets. Florida has been an interesting case study recently, where residents are starting to move because home insurance prices have risen, which has brought more listings to the market. However, demand is still strong, so the low but rising inventory and new listings have only raised prices as demand has grown.
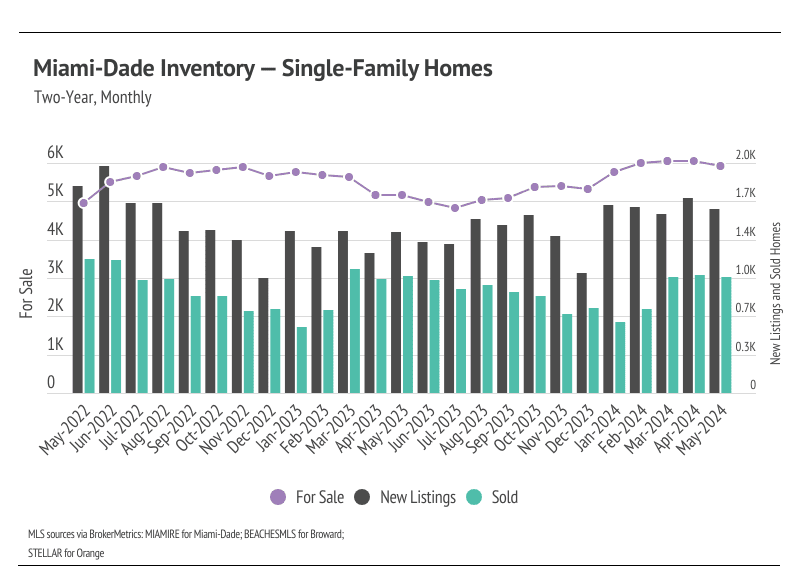
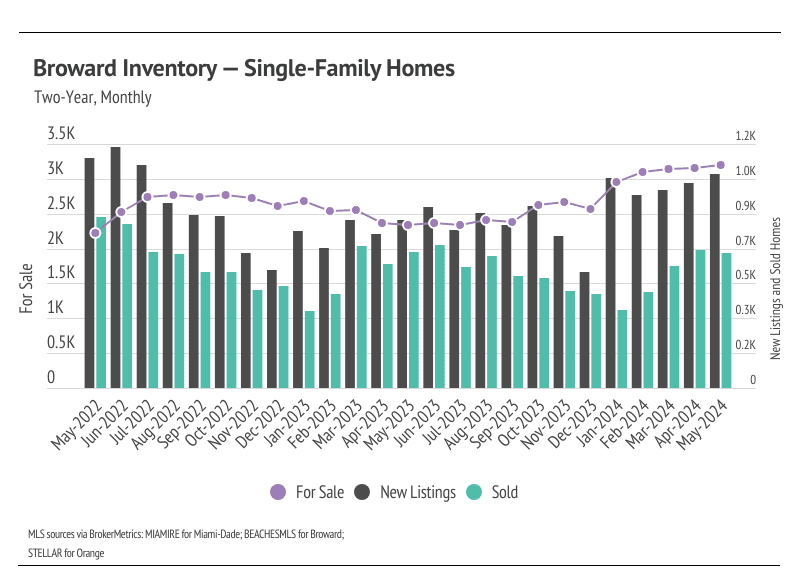
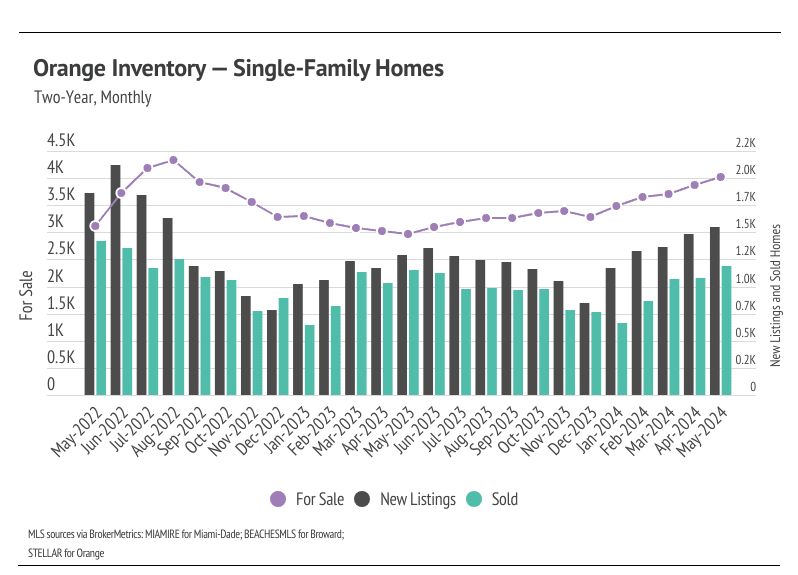
Supply and demand metrics are mixed in the selected Florida markets
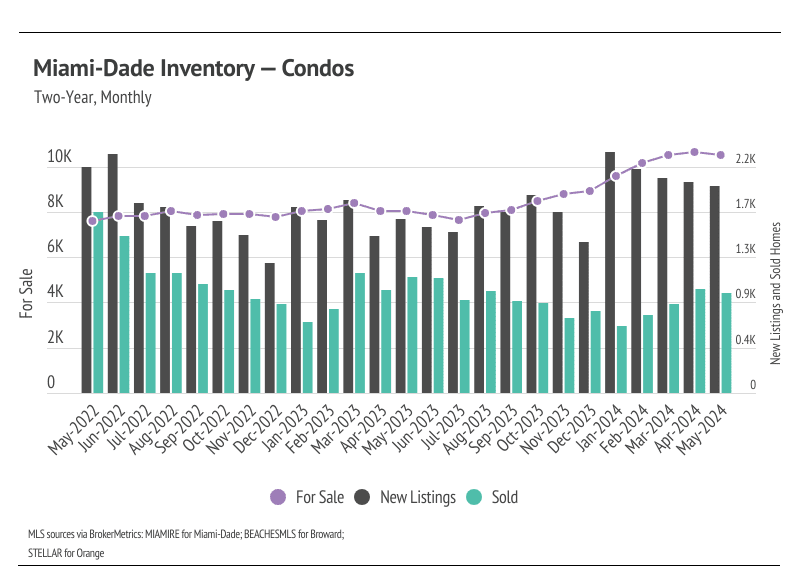
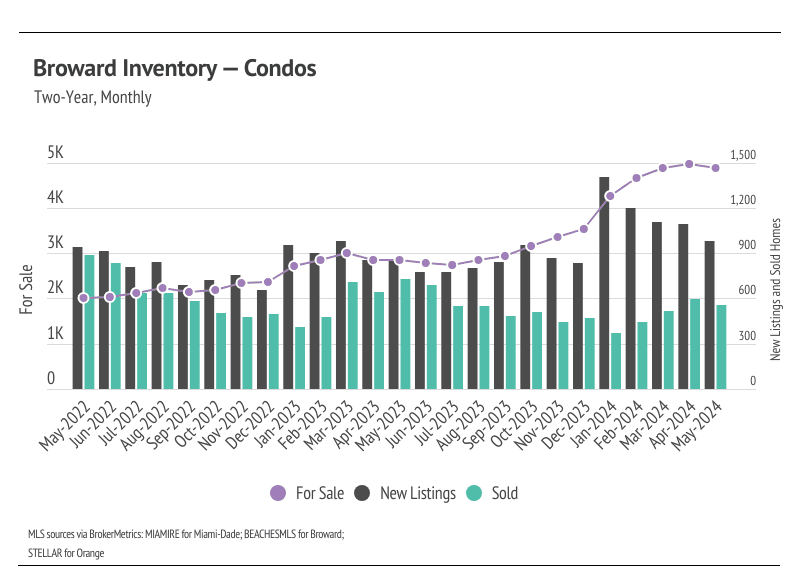
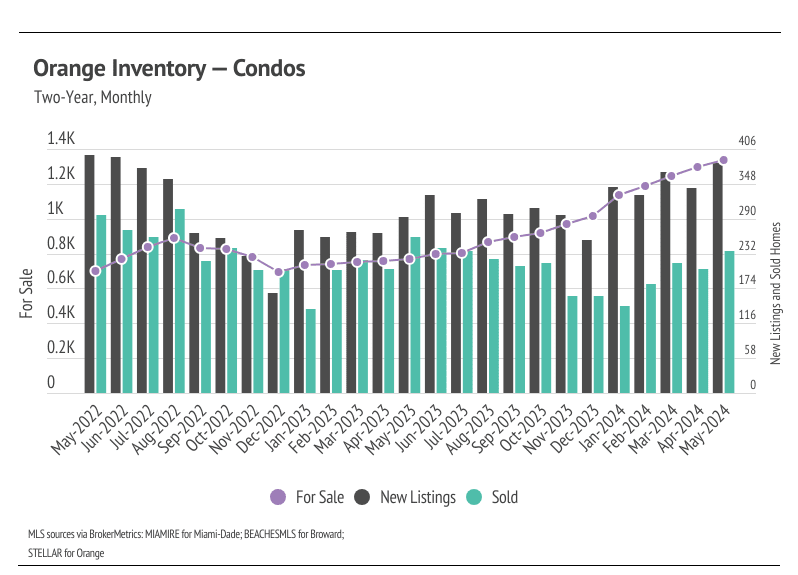
Florida inventory patterns have been atypical since the pandemic started. Homebuyers flocked to Florida, dropping inventory to hyper-low levels. Only recently has inventory begun to build. Low inventory and new listings, coupled with high mortgage rates, led to a substantial drop in sales and a generally slower housing market from June 2022 to the present. Typically, inventory begins to increase in January or February, peaking in July or August before declining once again from the summer months to the winter. In 2023, inventory patterns didn’t resemble the typical seasonal inventory wave. Luckily, inventory has grown substantially — especially for condos. The number of new listings coming to market is a significant predictor of sales, and the increase in new listings over the past few months has led to an increase in sales.
In terms of supply and demand metrics, in 2024, the selected markets aren’t trending similarly. Miami-Dade supply is showing signs that inventory will be tight for the rest of the year, and sales are slowing. Broward inventory is strong, but sales are also starting to slow. In Orange, both inventory and sales are still growing.
Months of Supply Inventory declined significantly from January to May 2024, indicating the market is getting more competitive for buyers
Months of Supply Inventory (MSI) quantifies the supply/demand relationship by measuring how many months it would take for all current homes listed on the market to sell at the current rate of sales. The long-term average MSI is around four to five months in Florida, which indicates a balanced market. An MSI lower than four indicates that there are more buyers than sellers on the market (meaning it’s a sellers’ market), while an MSI higher than five indicates there are more sellers than buyers (meaning it’s a buyers’ market). MSI rose significantly in the second half of 2023, largely due to the decline in sales and longer time on the market, and continued to rise in January 2024. However, January is unusual in that new listings jumped higher across the selected areas, which caused inventory to rise rapidly month over month and increased the proportion of active listings to sales. As expected, in February and March, MSI corrected and declined meaningfully across markets. In May, for single-family homes, MSI indicates sellers’ markets, and for condos, MSI indicates a balanced market in Orange and a buyers’ market in Miami-Dade and Broward.