The Big Story
Where can home prices go from here?
Quick Take:
Note: You can find the charts/graphs for the Big Story at the end of this section.
Highs (price) and lows (inventory) in the housing market
Income is one of the largest predictors of home price growth, second only to available supply. Consumers have more money to spend, which in turn drives up prices. But the increases in income haven’t kept up with the rise in home prices, especially in the last two years. In 2020, home prices increased 10% according to the Case-Schiller 20-City Composite Index, while median income decreased by 3%.
The disconnect between income and home prices is happening for two reasons. First, the ability to take on debt means that income doesn’t necessarily need to increase at a 1:1 ratio with home prices. Second, the pandemic changed buyer preferences, increasing the demand for homes and dropping inventory to previously unseen lows.
Because home price increases outpaced income growth, homebuyers needed to take on more debt to buy a home than they would have a few years ago. But due to the drop in interest rates, the monthly payment, even on a higher-priced home, becomes more affordable. For every 1% decrease in a 30-year mortgage rate, the price of the home can increase 13% without a change in monthly payment (and vice versa). For example, the monthly payment on a $500,000 mortgage at 4% is almost identical to the monthly payment for a $565,000 mortgage at 3%, a $65,000 difference.
The pandemic also changed buyer preferences. Rather than spending roughly half of our time at home, which is the norm, we were faced with endless time in our living spaces. (You remember — you were there.) As of September 2021, the United States has 59% fewer homes on the market, and 53% of that happened in the last two years. We were happy to see more homes on the market in the second quarter of 2021 because the increased supply helped satiate the high buyer demand, but we are already seeing the seasonal shift to fewer homes coming to market. Inventory will likely remain super low in the coming fall and winter months.
The market remains competitive for buyers, but conditions are making it an exceptional time for homeowners to sell. Low inventory means sellers will receive multiple offers with fewer concessions. With so many moving parts in real estate transactions, working with an experienced real estate agent is essential in smoothly navigating the entire buying and selling process.
Big Story Data
The Local Lowdown
The market is cooling but it’s still not a buyers’ market
Quick Take:
Note: You can find the charts/graphs for the Local Lowdown at the end of this section.
Home prices moved like stocks in 2021
The growth rates in 2021 are highly unusual and unsustainable in Florida; for example, home prices would more than double every five years at a 15% growth rate (every four years at 20%). After huge single-family home and condo price appreciation in the first half of the year, it made sense that the prices pulled back from July–October. Broward County condo prices were the one exception, returning to an all-time high in October. We expect the rapid appreciation to slow in the winter months — the seasonal norm.
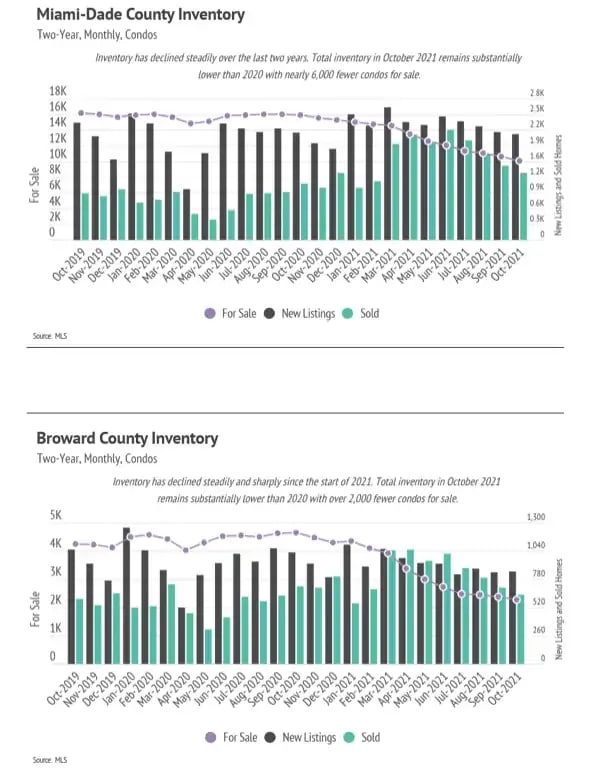
More supply, no problem
Single-family home and condo inventory continued to decline in 2021, bringing inventory to historic lows. August and September are typically the months with the highest inventory every year. In 2021, total inventory didn’t come close to last year’s level and was even further away from pre-pandemic levels. Even though we’re seeing some price correction after the first half of the year, the sustained low inventory will lift prices. Sales have been incredibly high, again highlighting demand in the area.
Homes are selling fast — really fast
Homes are selling extremely fast in Florida. The Days on Market reflects the high demand for homes in the area.
Months of Supply Inventory (MSI) quantifies the supply/demand relationship by measuring how many months it would take for all current homes for sale on the market to sell at the current rate of sales. The average MSI is four to five months in Florida, which indicates a balanced market. An MSI lower than that indicates that there are more buyers than sellers on the market (meaning it’s a sellers’ market), while a higher MSI indicates there are more sellers than buyers (meaning it’s a buyers’ market). Currently, single-family home and condo MSIs are historically low, indicating a sellers’ market, with the exception of the Miami-Dade condo market, which is more balanced.
Local Lowdown Data