The average 30-year mortgage rate began the year at 6.62%, marking the start of the third year mortgage rates have been elevated. However, the rate expectations for 2024 in January were far different from those today. In January, inflation was still trending lower and economists were predicting rate cuts as early as March. Unfortunately, the inflation rate stopped falling around 3%, never quite reaching the 2% target, which has caused the Fed to delay cutting the federal funds rate, which indirectly, but significantly, influences credit markets. The past two months, in fact, inflation has increased year over year, which isn’t ever going to move the timetable for rate cuts earlier.
During its May meeting, the Federal Reserve unanimously voted to hold policy rates steady for the sixth consecutive time, leaving the federal funds target rate unchanged at 5.25% to 5.50%. Importantly, Fed Chair Jerome Powell emphasized that it’s unlikely that the next policy rate move will be a hike; it’s more likely that rates remain steady and with less clarity of cuts. The Fed’s dual mandate aims for stable prices (inflation ~2%) and low unemployment. The jobs market is still strong, so really, it’s all about inflation.
The Fed’s change of tune has led to much higher mortgage rates. Mortgage rates have risen 0.6% since the start of the year, and two thirds of that increase happened in April. Rising rates, especially quickly rising rates, only slow the housing market. As we entered May, the average 30-year mortgage rate hit 7.22% — the highest level in 2024 and not too far off from the 23-year high of 7.79% hit last year. During April, prices and rates increased, thereby decreasing affordability. For buyers planning to finance a home, the 0.38 percentage point increase that occurred in April affects the monthly cost of a home dramatically. When we couple the median price increase with the mortgage rate increase in just the month of April, the monthly cost increased 7%. If we compare the month cost in January to April, the monthly cost rose 13%.
Rates seem to be able to inflate prices and increase sales when they’re low, but when they’re high, they only slow sales — or, at least, that’s been the experience over the past four years. Inventory is, of course, driving the disconnect. Demand is still high relative to supply, even though inventory is growing. However, as prices increase, the buyers who haven’t been priced out of the market become pickier, and fewer but pickier buyers creates an overall slowdown. The market was showing signs of a more normal spring with sales and inventory rising, but the recent rate increases dropped sales last month, which is almost never seen in the spring. Even though mortgage rates have been elevated for long enough that it feels more normal, mortgage rates above 7% will naturally give potential buyers and sellers pause before entering the housing market.
Different regions and individual houses vary from the broad national trends, so we’ve included a Local Lowdown below to provide you with in-depth coverage for your area. As always, we will continue to monitor the housing and economic markets to best guide you in buying or selling your home.
Big Story Data


The Local Lowdown
-
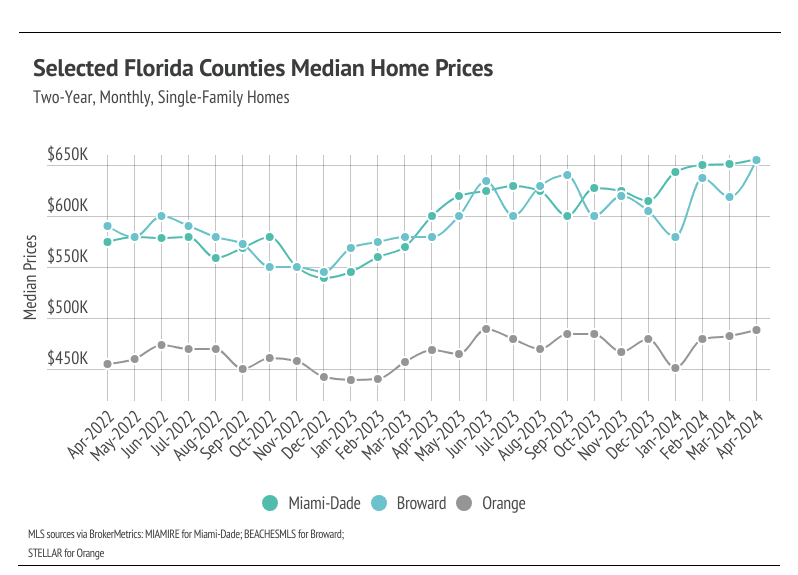
Single-family home prices in Miami-Dade and Broward counties rose month over month, reaching new all-time highs. Prices are at or near record highs in the selected markets, and we expect new highs across markets within the next few months.
-
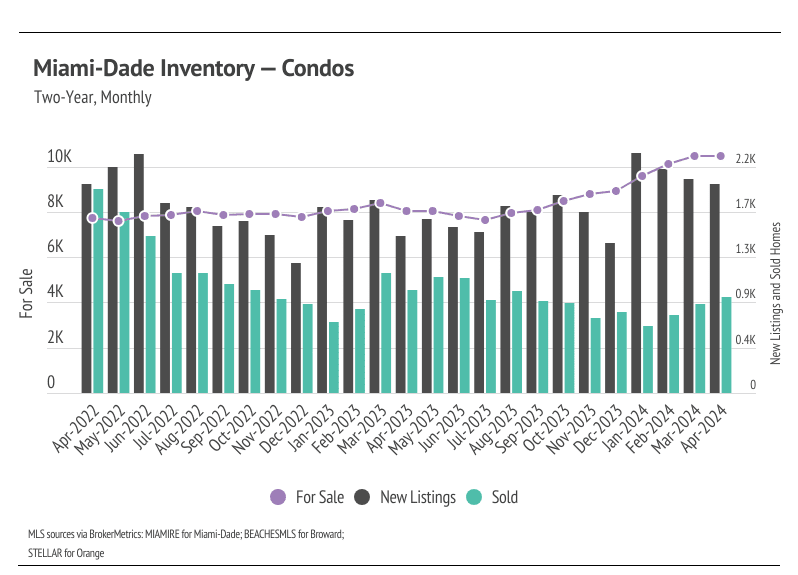
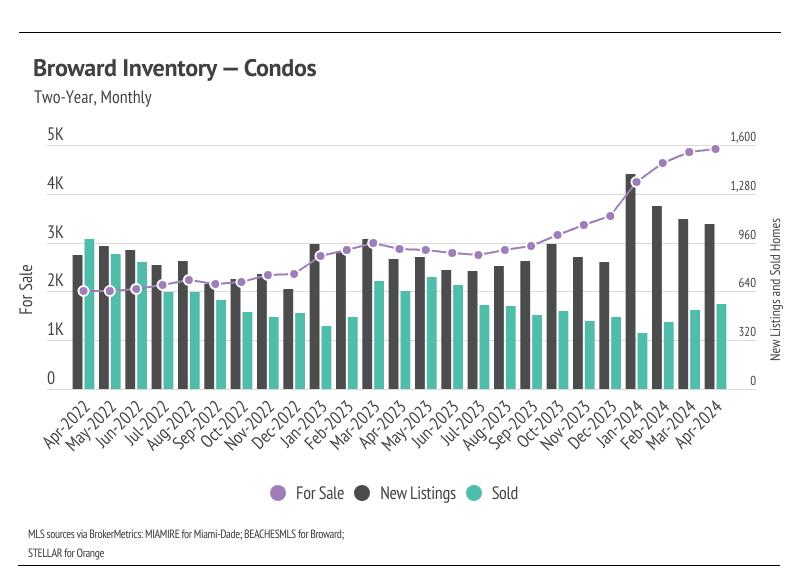
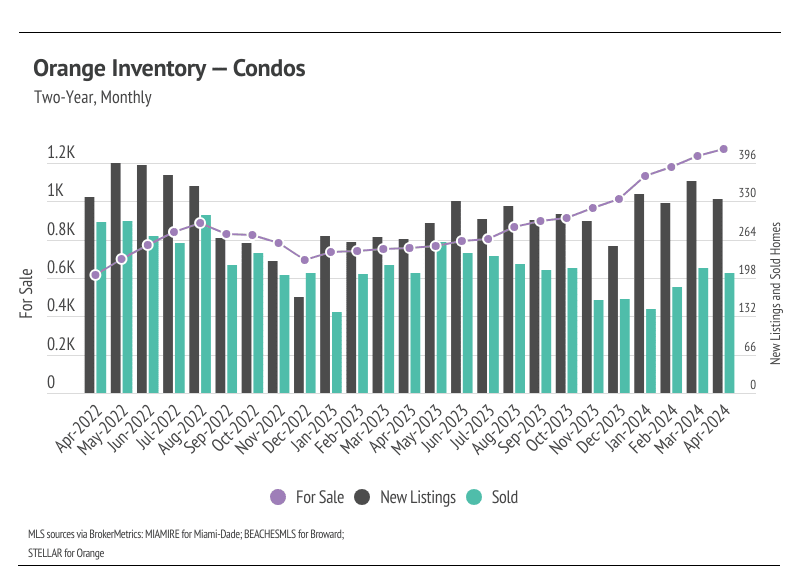
Active listings have risen significantly for single-family homes and condos in 2024. The market is also seeing more new listings and increasing sales, which are both good for a healthier market.
-
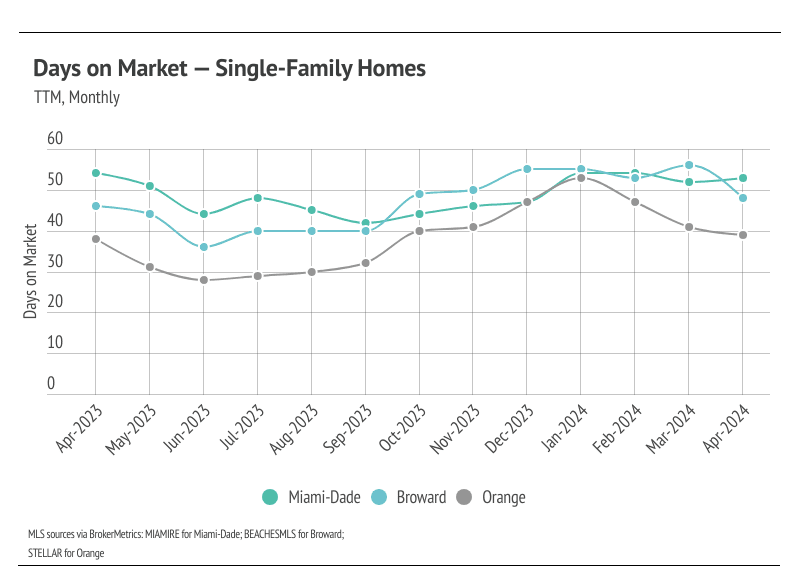
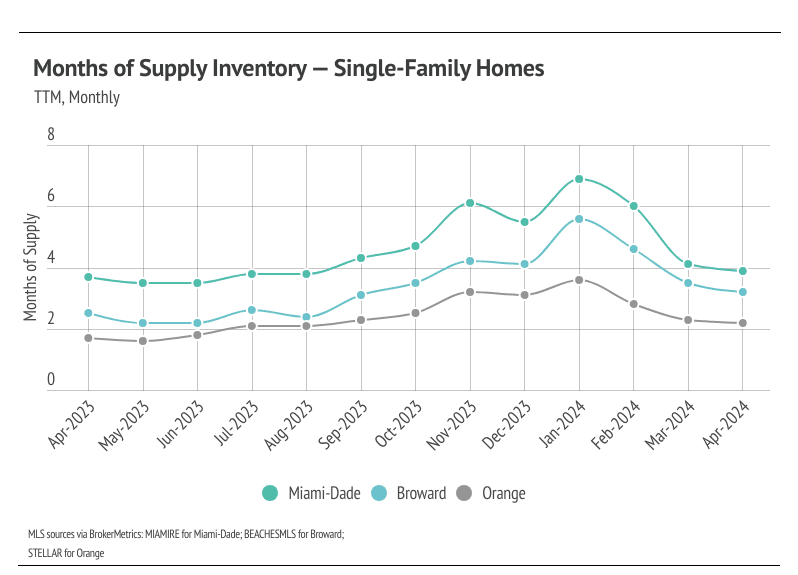
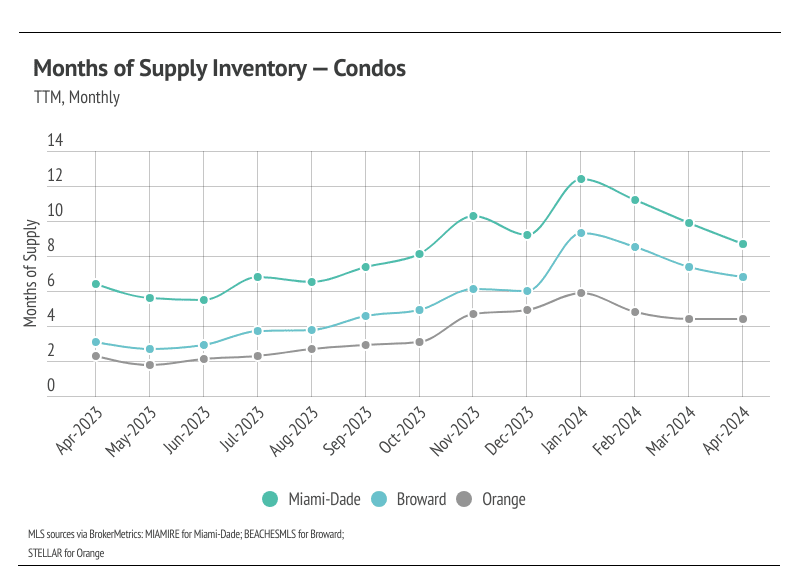
Months of Supply Inventory fell across markets over the past three months. Currently, for single-family homes, MSI indicates the selected markets favor sellers. For condos, MSI indicates a balanced market in Orange and a buyers’ market in Miami-Dade and Broward.
Note: You can find the charts/graphs for the Local Lowdown at the end of this section.
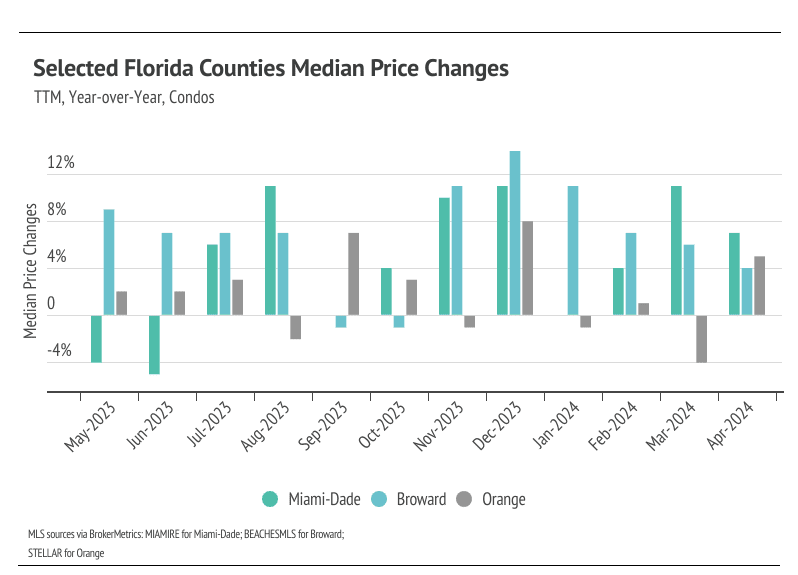
Median single-family home prices in Miami-Dade and Broward hit all-time highs in April
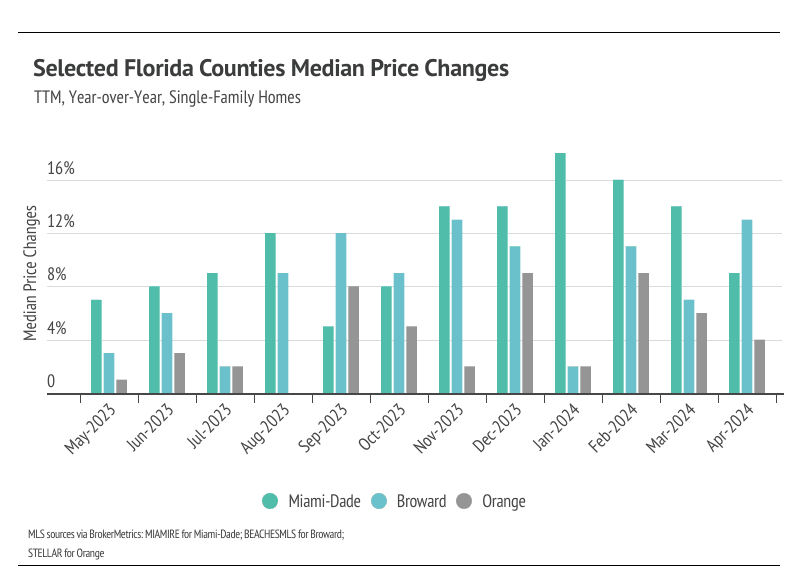
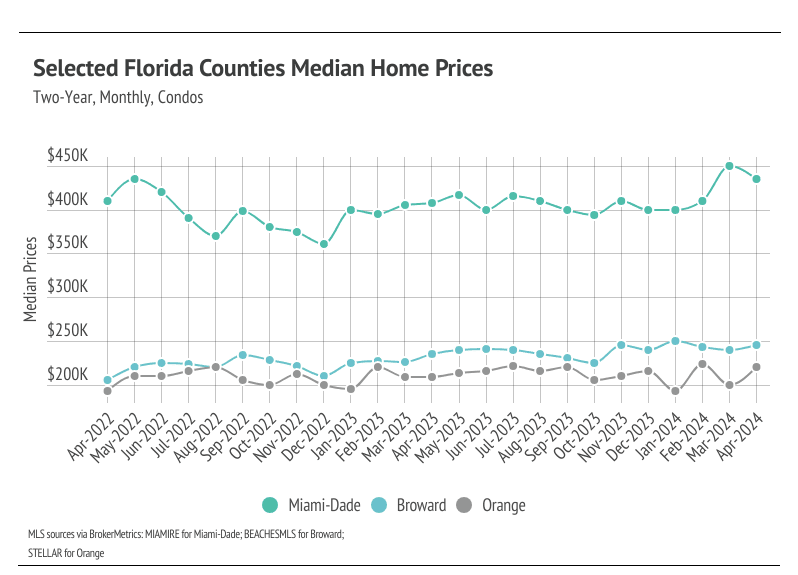
In Florida, home prices haven’t been largely affected by rising mortgage rates — even recently reaching all-time highs during a period of rapidly rising mortgage rates. In February, the median single-family home prices in Miami-Dade and Broward, and the median condo price in Orange, all hit all-time highs. In March, Miami-Dade single-family home and condo prices continued that trend, reaching new all-time highs again. Although Miami-Dade condo prices fell from the all-time high last month, single-family home prices in Miami-Dade and Broward reached record highs in April. Prices almost never peak this early in the year, indicating that home prices will likely rise to a new high in almost every month during the first half of the year. Florida has been in an interesting spot recently, where residents are starting to move because home insurance prices have risen, which has brought more listings to the market. However, demand is still strong, so the low but rising inventory and new listings will only raise prices as demand grows. More homes must come to the market in the spring and summer to get anything close to a healthy market, and we are already seeing more new listings coming online.
High mortgage rates soften both supply and demand, but homebuyers seemed to tolerate rates above 6%. Now that rates are above 7%, sales may slow slightly in the next couple of months, which isn’t great for the market, but isn’t it terrible, either, as it may allow inventory to build in a massively undersupplied market.
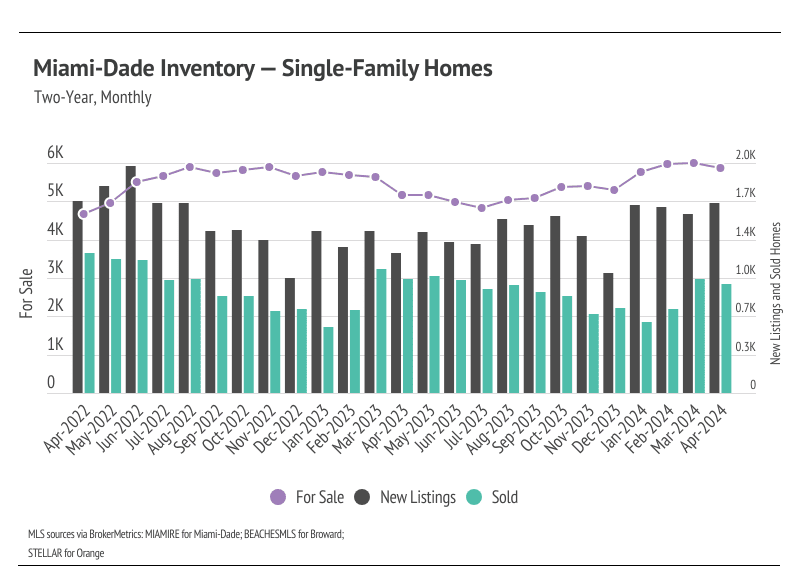
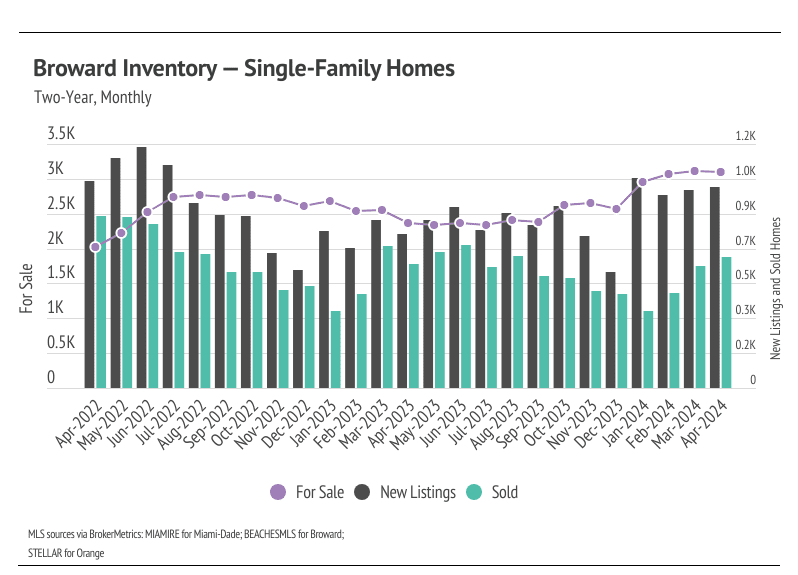
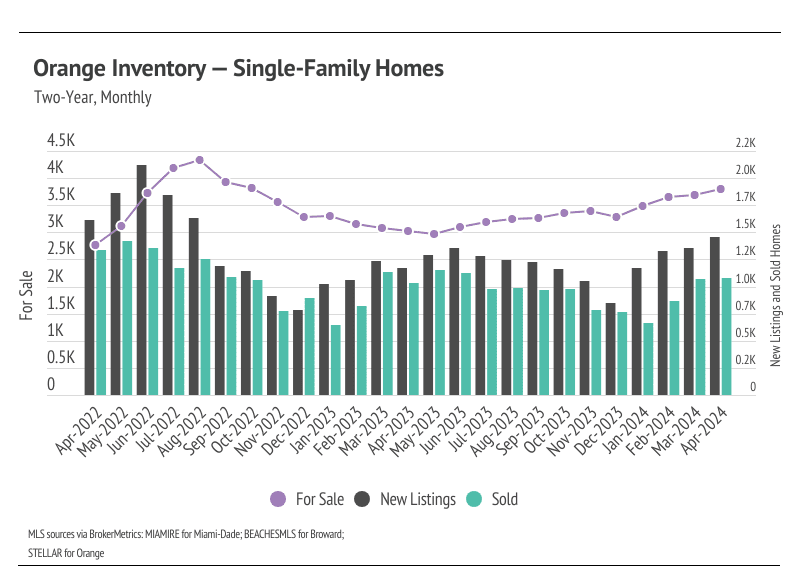
Inventory declined for single-family homes in Miami-Dade and Broward in April, which may indicate tight supply for the rest of the year in those markets
Florida inventory patterns have been atypical since the pandemic started. Homebuyers flocked to Florida, dropping inventory to hyper-low levels. Only recently has inventory begun to build. Low inventory and new listings, coupled with high mortgage rates, led to a substantial drop in sales and a generally slower housing market from June 2022 to the present. Typically, inventory begins to increase in January or February, peaking in July or August before declining once again from the summer months to the winter. In 2023, inventory patterns didn’t resemble the typical seasonal inventory wave. Luckily, inventory has grown substantially — especially for condos. The number of new listings coming to market is a significant predictor of sales, and the increase in new listings over the past few months has led to an increase in sales. Demand is definitely ramping up in Florida, and more supply will mean a healthier market.
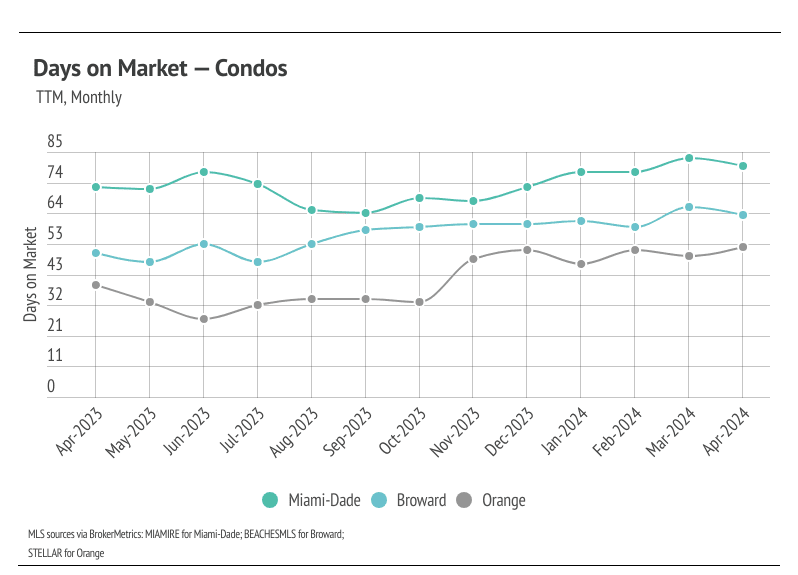
Months of Supply Inventory declined from January to April 2024, indicating the market is getting more competitive for buyers
Months of Supply Inventory (MSI) quantifies the supply/demand relationship by measuring how many months it would take for all current homes listed on the market to sell at the current rate of sales. The long-term average MSI is around four to five months in Florida, which indicates a balanced market. An MSI lower than four indicates that there are more buyers than sellers on the market (meaning it’s a sellers’ market), while an MSI higher than five indicates there are more sellers than buyers (meaning it’s a buyers’ market). MSI rose significantly in the second half of 2023, largely due to the decline in sales and longer time on the market, and continued to rise in January 2024. However, January is unusual in that new listings jumped higher across the selected areas, which caused inventory to rise rapidly month over month and increased the proportion of active listings to sales. As expected, in February and March, MSI corrected and declined significantly across markets. Currently, for single-family homes, MSI indicates sellers’ markets, and for condos, MSI indicates a balanced market in Orange and a buyers’ market in Miami-Dade and Broward.