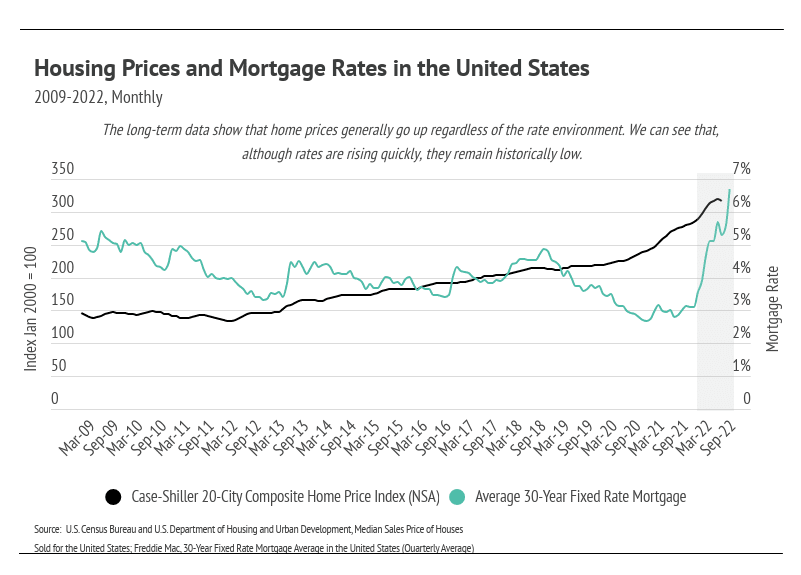
We don’t love to make outright predictions, but enough data has been released to suggest that home prices peaked nationally in June 2022, and we likely won’t see another peak this year. Of course, there will be deviations in local markets, but the larger trend is clear: Home prices cannot sustain the growth rate we’ve seen over the past two years.
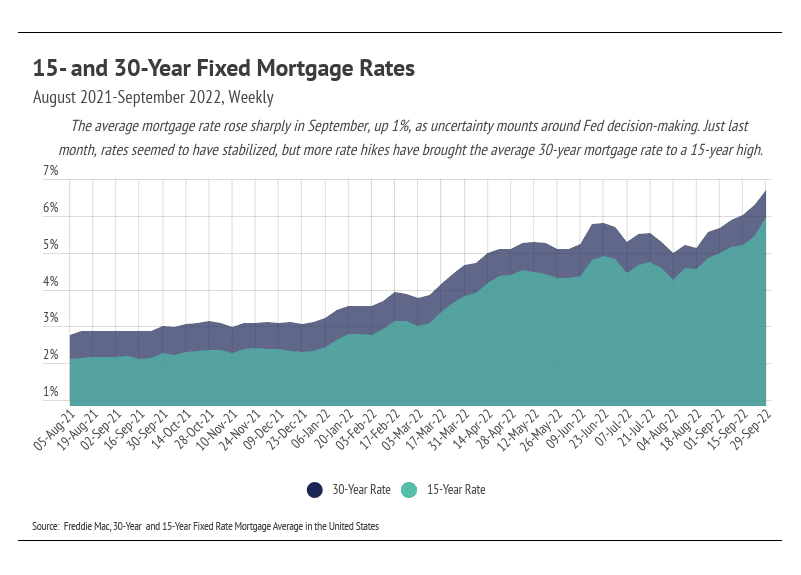
The Fed provided huge incentives to buy homes as part of its easy monetary policy during the pandemic by purchasing Mortgage-Backed Securities (MBS) and dropping interest rates. MBS play an integral role in home financing by allowing banks to bundle and sell mortgage loans, thereby turning the bank into an intermediary between the financier and financial markets (investors). Banks get some fees, and investors, rather than the bank, get the interest from the bundle of mortgages, so in many ways, the bank facilitates the loan but investors are the ones really lending the buyer the money. The Fed was a huge investor in 2020 and 2021, doubling its MBS holdings to $2.7 trillion. However, the Fed isn’t buying any more MBS and, in fact, would like to sell — but can’t do so without taking huge losses. Additionally, mortgage rates have jumped dramatically in 2022, more than doubling, which shines a light on just how unique 2021 was for homebuying.
Last September, the average 30-year mortgage rate was 3.01%, meaning that a $500,000 loan would cost $2,100 per month. (That same loan now costs $3,200 per month at 6.70%.) Because the interest rate has such an outsized impact on the affordability of a home, more buyers entered the market, dropping inventory like never before. It was a great time to finance a home, and those buyers who had a down payment rightfully bought even as prices were increasing, since home prices typically continue to increase. This is actually a newer phenomenon, but one that isn’t going away. Since the mid-1990s, home prices began to move more like risk assets (stocks, bonds, commodities, etc.), which marked a huge change from the preceding 100 years. From 1890 to 1990, inflation-adjusted home prices rose only 12%, which is hard to imagine with the massive price growth, up 70% nationally, that we’ve seen over the past 10 years.
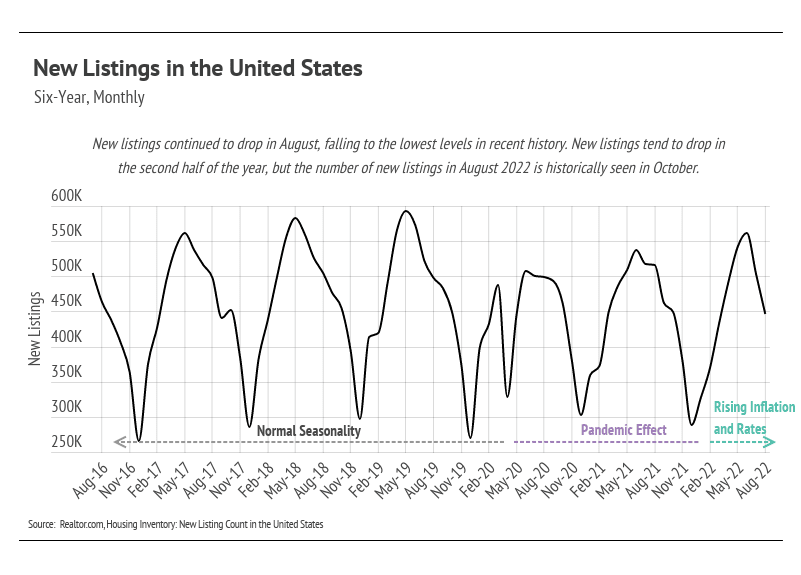
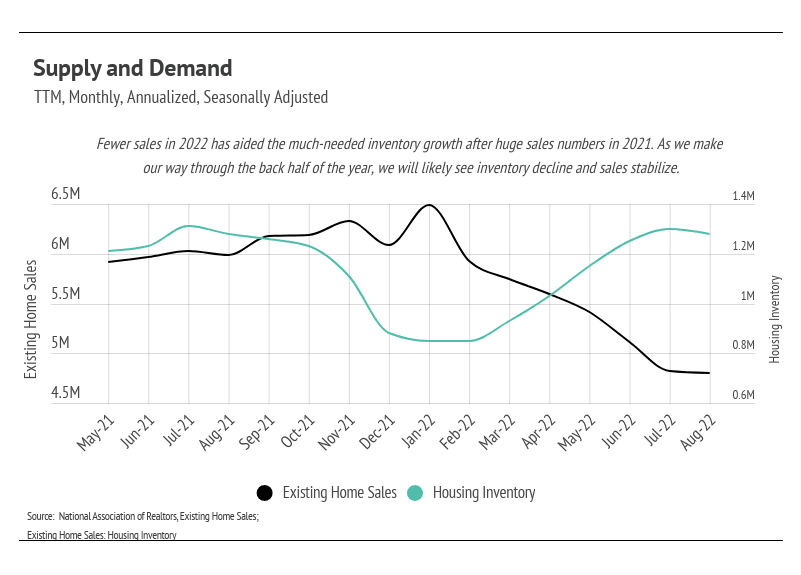
Demand for homes has declined over the past three months, which, besides the rate increase, is the seasonal norm. Because home sellers are often buying as they sell, new listings have dropped as well, causing inventory to decline. Inventory is still historically low and will be the one major buoy for home prices. The market has shifted to softening demand and softening supply. Mortgage applications are down 29% year-over-year according to the Mortgage Bankers Association. This, too, isn’t terribly surprising. Generally, homes aren’t bought and sold over and over in short time frames. The high number of sales in 2021 indicates fewer sales in 2022, especially because the buying incentives in 2021 are no longer in place. We can finally say that the market is cooling, but after the hottest two years since the mid-2000s, cooling indicates a healthier market.
The U.S. housing market has become more nuanced over the past several months and depends more than ever on the region. Some parts of the country are trending closer to balance, while some are moving deeper into a seller’s market. Take a look below at the Local Lowdown for in-depth coverage of your area. As always, we will continue to monitor the housing and economic markets to best guide you in buying or selling your home.
Big Story Data
The Local Lowdown
-
Florida’s housing market is cooling after a huge appreciation over the past two years.
-
Sales and new listings are on the decline, which will reduce inventory as we head into winter.
-
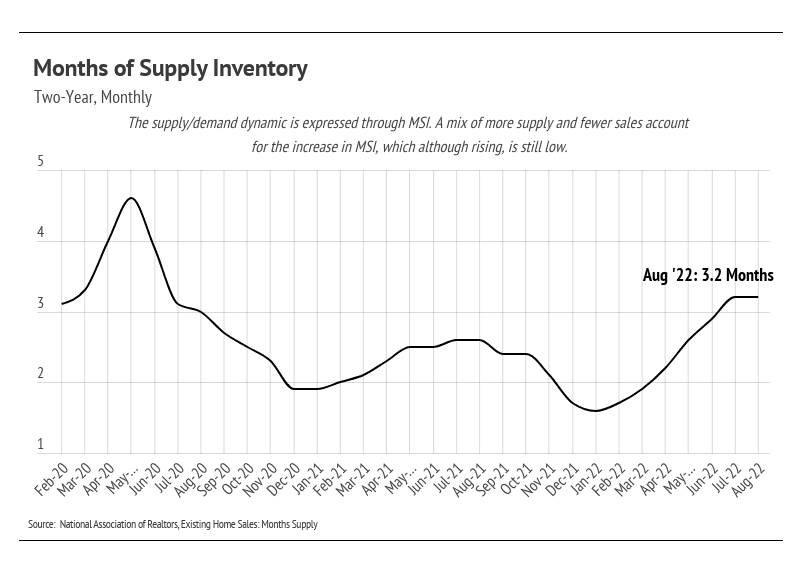
Months of Supply Inventory indicates that the market is trending toward more balance between buyers and sellers.
Note: You can find the charts/graphs for the Local Lowdown at the end of this section.
Price contraction after explosive growth is normal
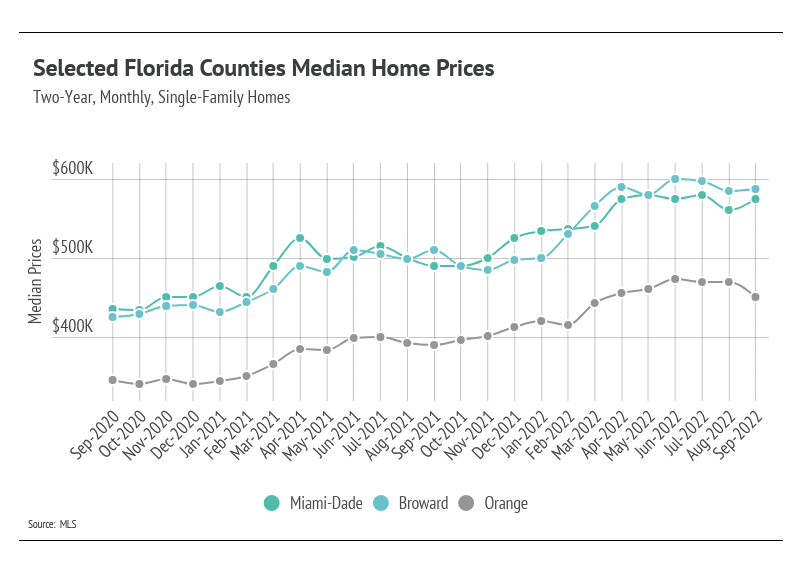
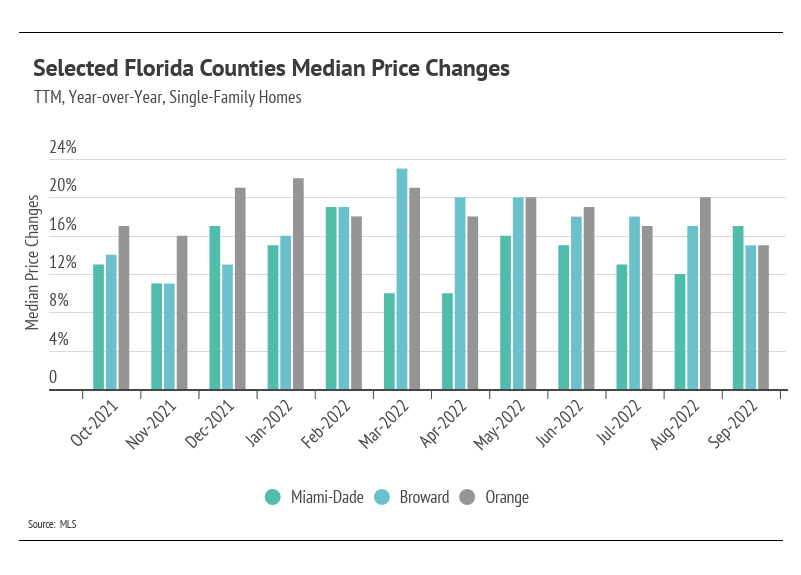
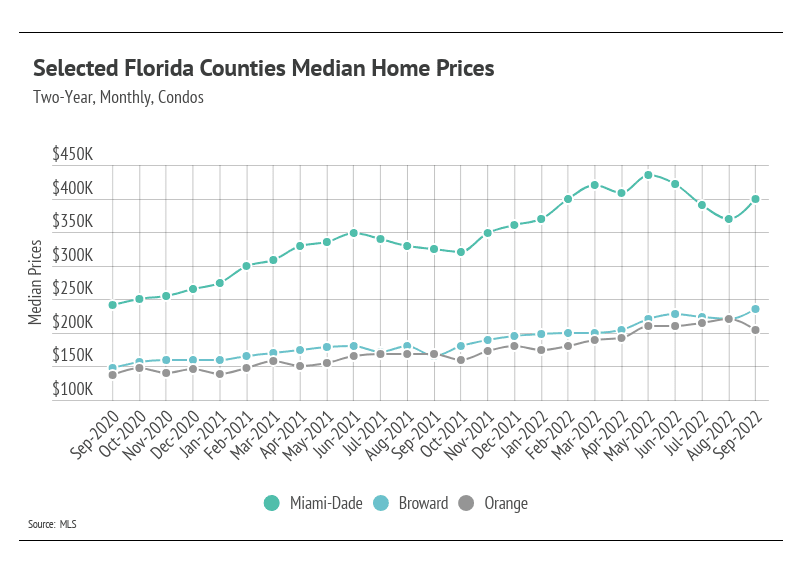
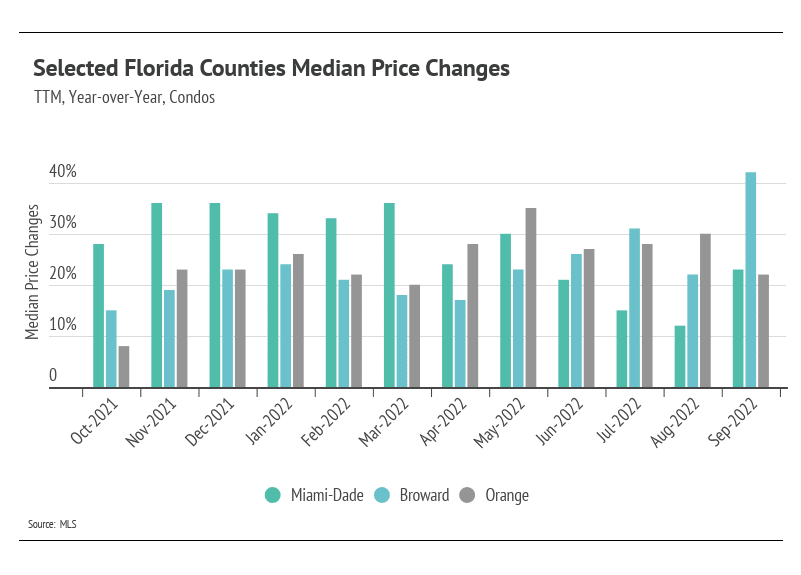
When we consider the increases in mortgage rates and normal seasonal trends this time of year, when prices tend to stagnate or decline slightly, the price contractions that single-family homes and condos experienced since their peaks reached earlier this year aren’t alarming. Yes, we are moving into a new chapter in the housing market that doesn’t involve astronomical price increases and 20 offers the first day the home gets listed, but that’s actually a good thing. Home prices in Texas grew at an unsustainable rate, and a slight contraction is a normal response to that sort of growth. For example, home prices in Miami-Dade County would double every five years for single-family homes and every 2.5 years for condos at the 2021 growth rate. We are now entering a stage of slower growth — but still growth. Real estate has shown itself to be one of the best investments in recent history and is, on average, the largest store of wealth for an individual or family. Price appreciation will likely move to a more normal growth rate of around 5-6% in the coming years.
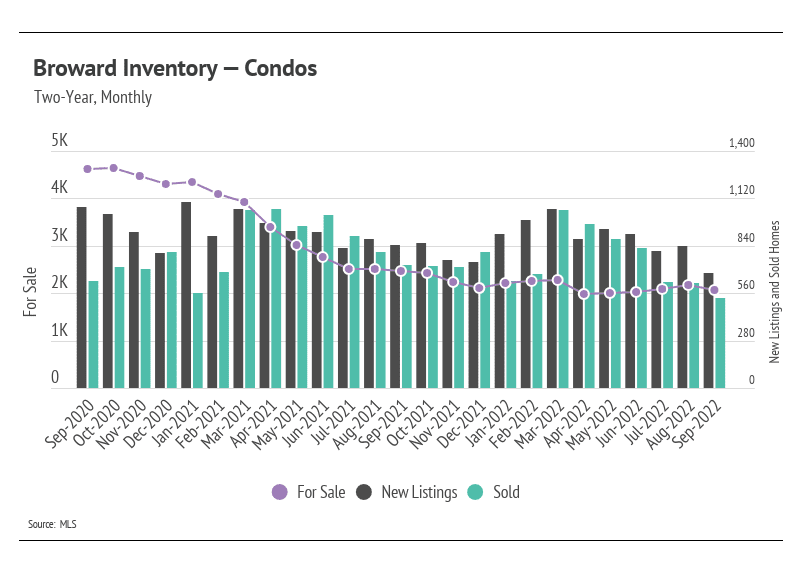
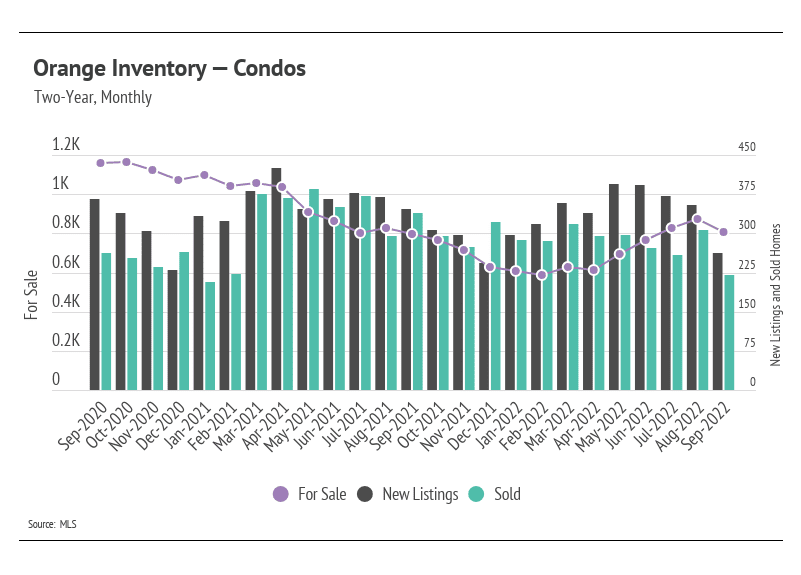
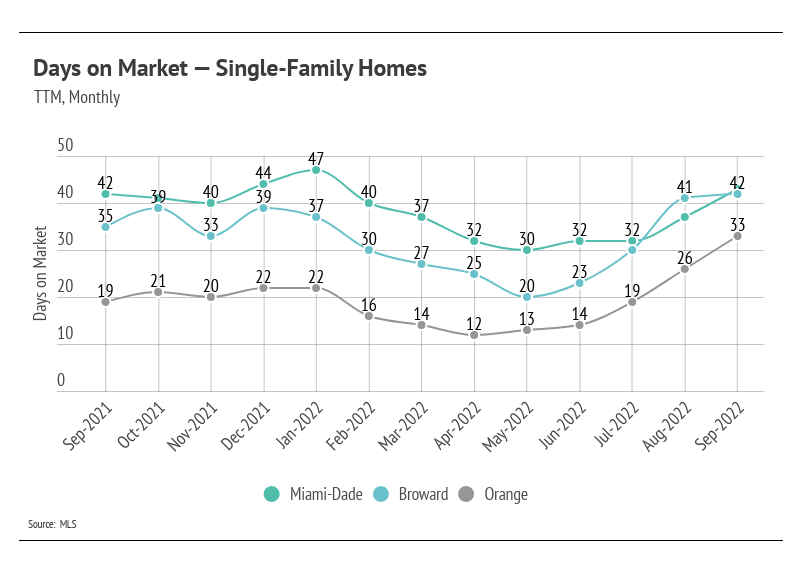
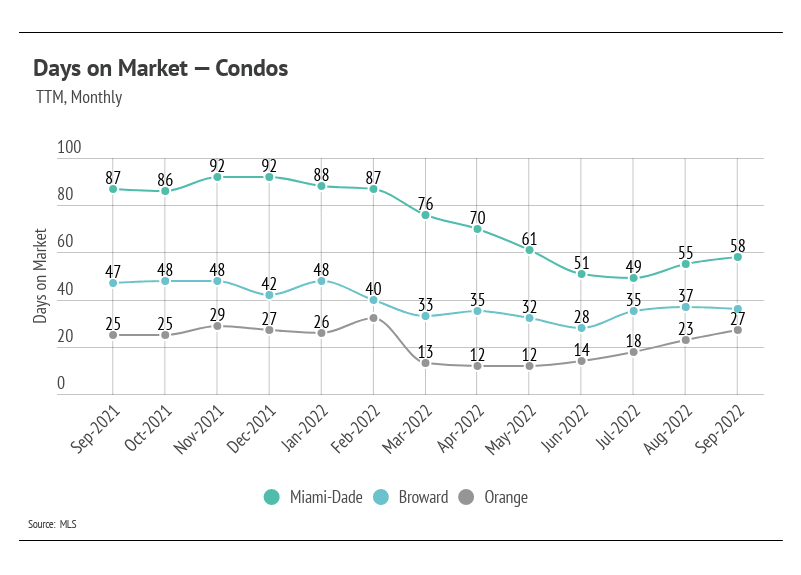
Fall sales slowdown
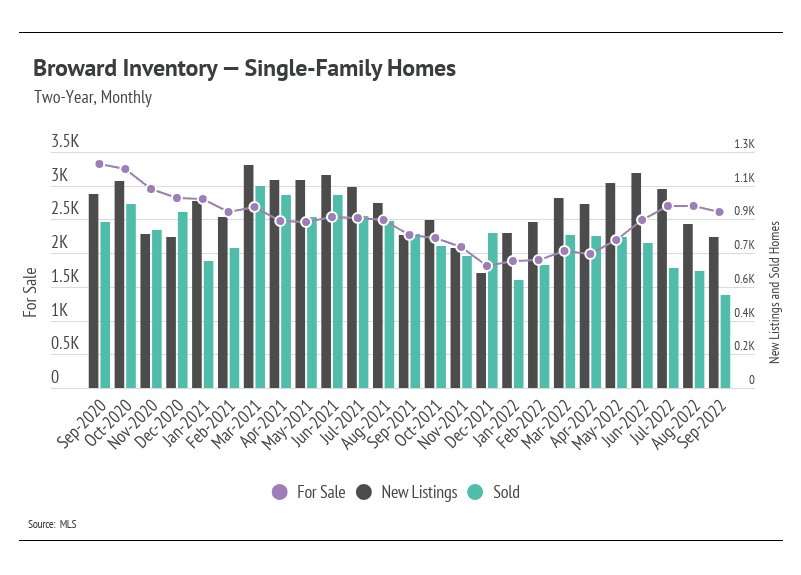
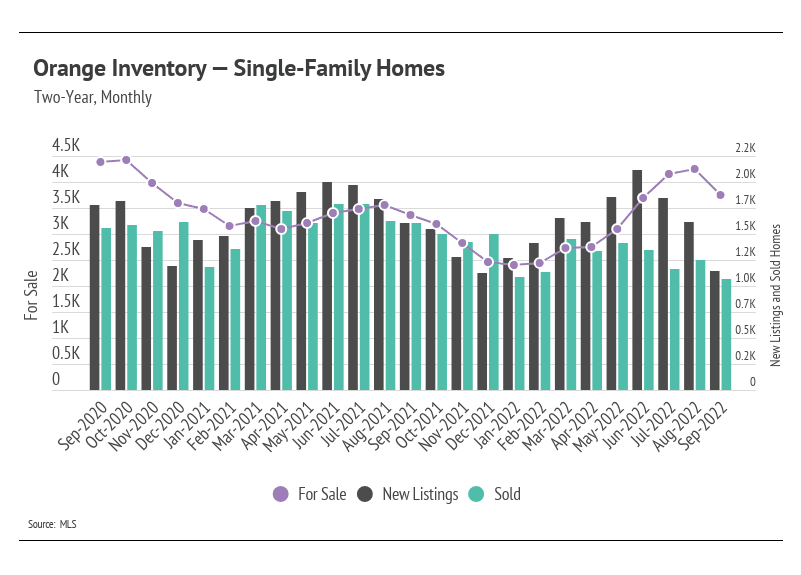
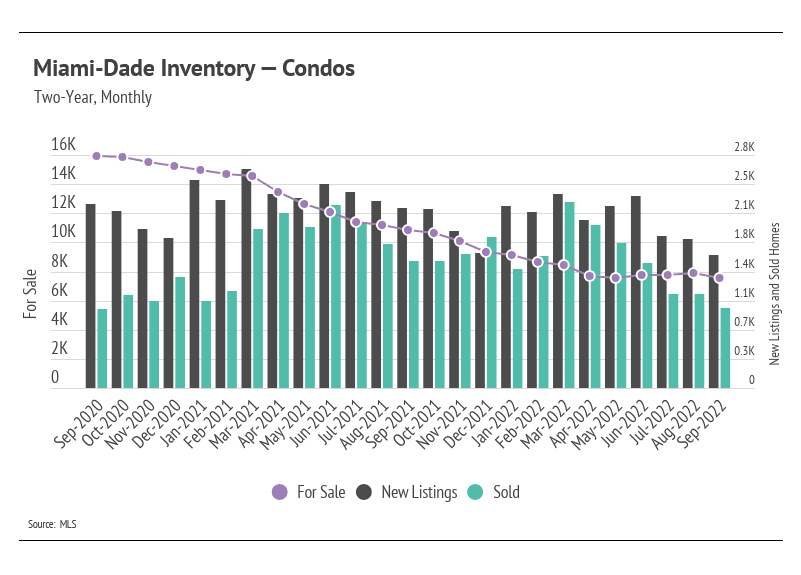
Single-family home and condo sales declined month-over-month across the selected Florida markets, along with new listings, which caused inventory to decline. Notably, Miami-Dade condo inventory fell to an all-time low in September. Florida metro areas, along with the rest of the country, have not returned to pre-pandemic inventory levels. Homes have generally sold faster over the past two years, making new listings more and more important to the market. Inventory generally grows when new listings increase or homes sit on the market. With rates rising at such a rapid pace, new listings are slowing considerably. We can tie new listings not only to supply, but to demand as well, because sellers are often buying, too. Softening demand has brought the market closer to balance despite historically low inventory.
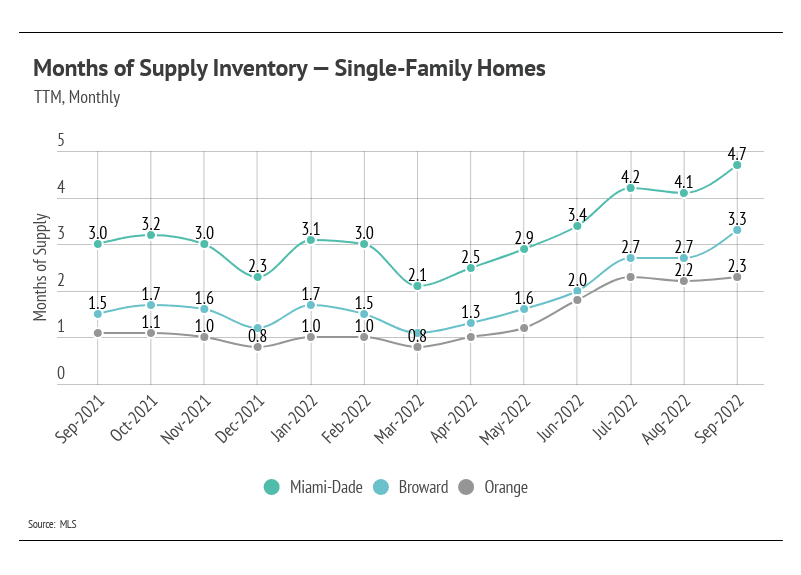
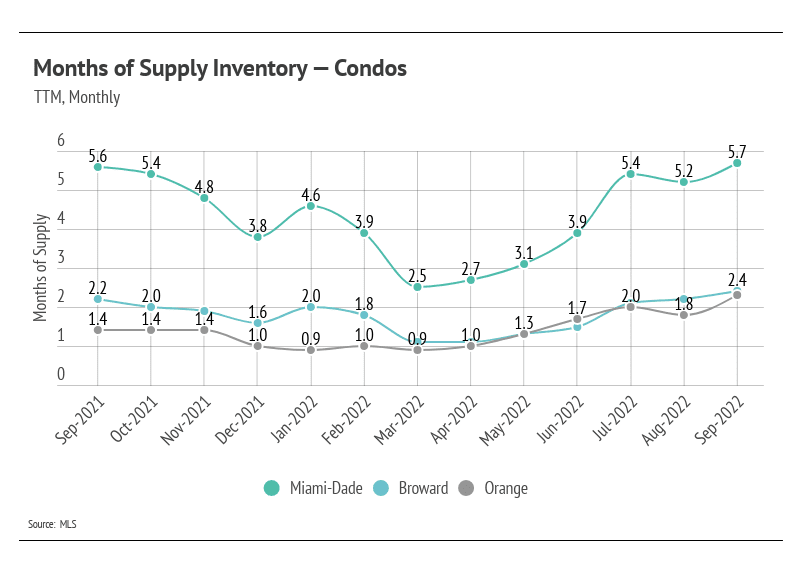
Months of Supply Inventory implies a balanced market for single-family homes
Months of Supply Inventory (MSI) quantifies the supply/demand relationship by measuring how many months it would take for all current homes listed on the market to sell at the current rate of sales. The long-term average MSI is around four to five months in Florida, which indicates a balanced market. An MSI lower than four indicates that there are more buyers than sellers on the market (meaning it’s a sellers’ market), while a higher MSI indicates there are more sellers than buyers (meaning it’s a buyers’ market). In September, single-family home and condo MSIs remained low in Broward and Orange counties, indicating a sellers’ market. Miami-Dade MSI has moved toward balance for single-family homes and a buyers’ market for condos.