Look, we've all been there. You’re running a prominent regional bank that holds an outsized amount of uninsured deposits, which are overly concentrated in the tech sector, all while holding a huge, unhedged, long-dated bond portfolio that has taken a major hit over the past year due to rising interest rates. Then you’re forced to sell that portfolio, realizing a major loss, to provide liquidity to your depositors who need to withdraw their money to pay their bills after venture capital stops flowing. The major loss leads to a modern-day bank run and seizure of the bank by U.S. regulators, creating a domino effect that causes another bank failure and widespread concerns over systemic risk of the banking system. Of course, this may not describe you exactly, but the story may sound familiar, and you may be wondering if the uncertainty in the banking system affects you. The answer is probably a familiar one: maybe.
Banks are tightening their credit standards to hold more liquid assets on their balance sheets, so they may be less willing to lend out . However, credit has been tightening for over a year now as interest rates have risen, and banks also often sell their mortgages by way of Mortgage-Backed Securities (MBS), so they don’t have to hold the long-term loans on their balance sheets. If a creditworthy homebuyer qualified for a loan before the bank failures, they almost surely still qualify today. In the short term, we don’t expect major mortgage rate moves due to the Silicon Valley Bank and Signature Bank failures.
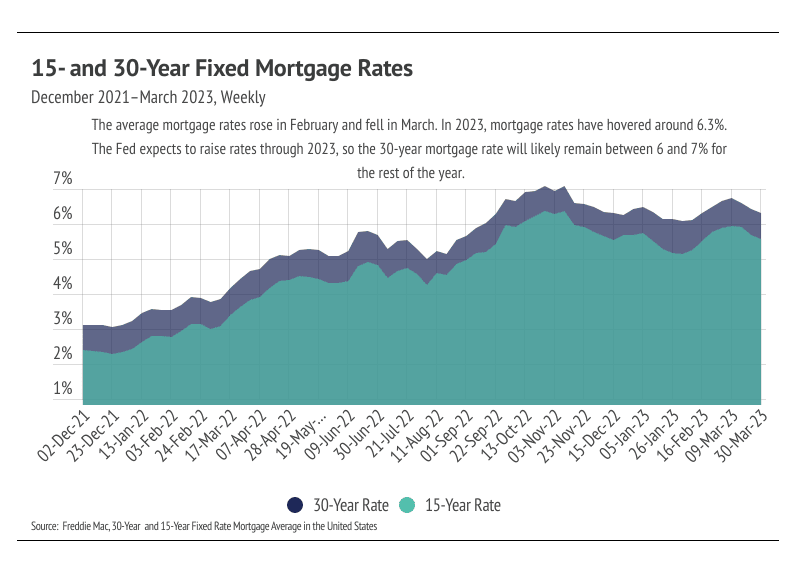
The Fed, which coincidentally met right after the bank failures, chose to raise their benchmark rate by 0.25%, rather than the anticipated 0.50%, in a continuing effort to combat inflation. The Fed chose the smaller 0.25% hike because banks were already tightening after the bank failures, so the Fed had less of a need to do so as well. Inflation is still well above the 2% target, although it’s coming down steadily. At the current rate at which inflation is dropping, it should be back to the target rate in about a year. One caveat that could slow declining inflation is OPEC’s surprise announcement that they are cutting oil production, which will cause gas prices to increase over the next few months. All this to say, interest rates will remain elevated and volatile over the next 12 months, and, more specifically, mortgage rates will likely hover around 6-7%.
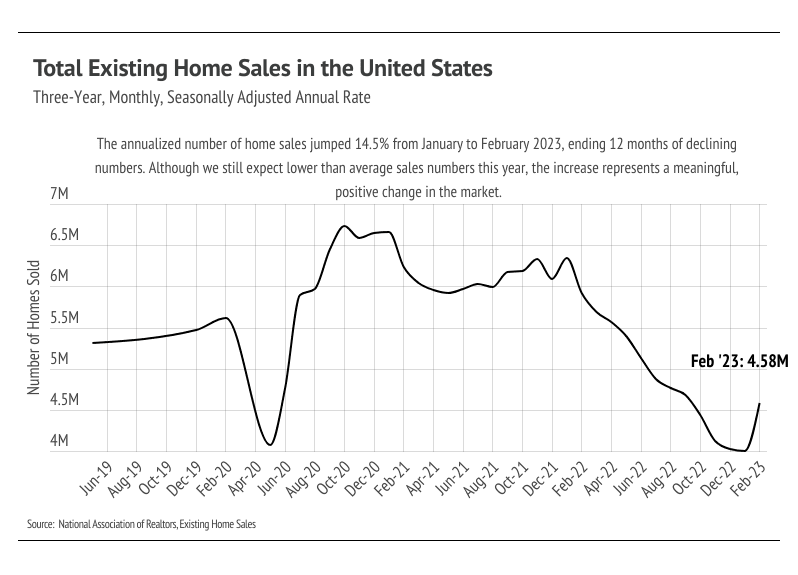
The 30-year average mortgage rate has been above 6% for six months now, and a significant number of buyers are finally coming back to the market. According to the National Association of Realtors (NAR), sales jumped 14.5% in February, the largest month-over-month increase since July 2020, breaking the 12-month streak of declining sales. We attribute three main factors to the increase: (1) the initial sticker shock of higher rates has worn off, (2) the time before buyers refinance has shortened, and (3) typical seasonality has returned. As rates shot up in 2022, affordability plummeted, causing a huge number of potential buyers to get priced out of the market or, at least, reassess purchasing a home. As inflation continues to decline, the Fed has offered a clearer picture of their path. They will raise the federal funds rate through 2023 to around 5.5% and then lower rates by about 2% over the course of 2024 and 2025. Buyers, who are expecting to refinance, therefore, have more of a timeline for when they can expect lower rates. The monthly mortgage cost is reduced by 10% for every 1% decrease in the mortgage rate, so buyers can greatly reduce their monthly cost as rates fall.
Different regions and individual houses vary from the broad national trends, so we’ve included a Local Lowdown below to provide you with in-depth coverage of your area. In general, higher-priced regions have been hit harder by mortgage rate hikes than less expensive markets due to the absolute dollar cost of the rate hikes. As always, we will continue to monitor the housing and economic markets to best guide you in buying or selling your home.
Big Story Data
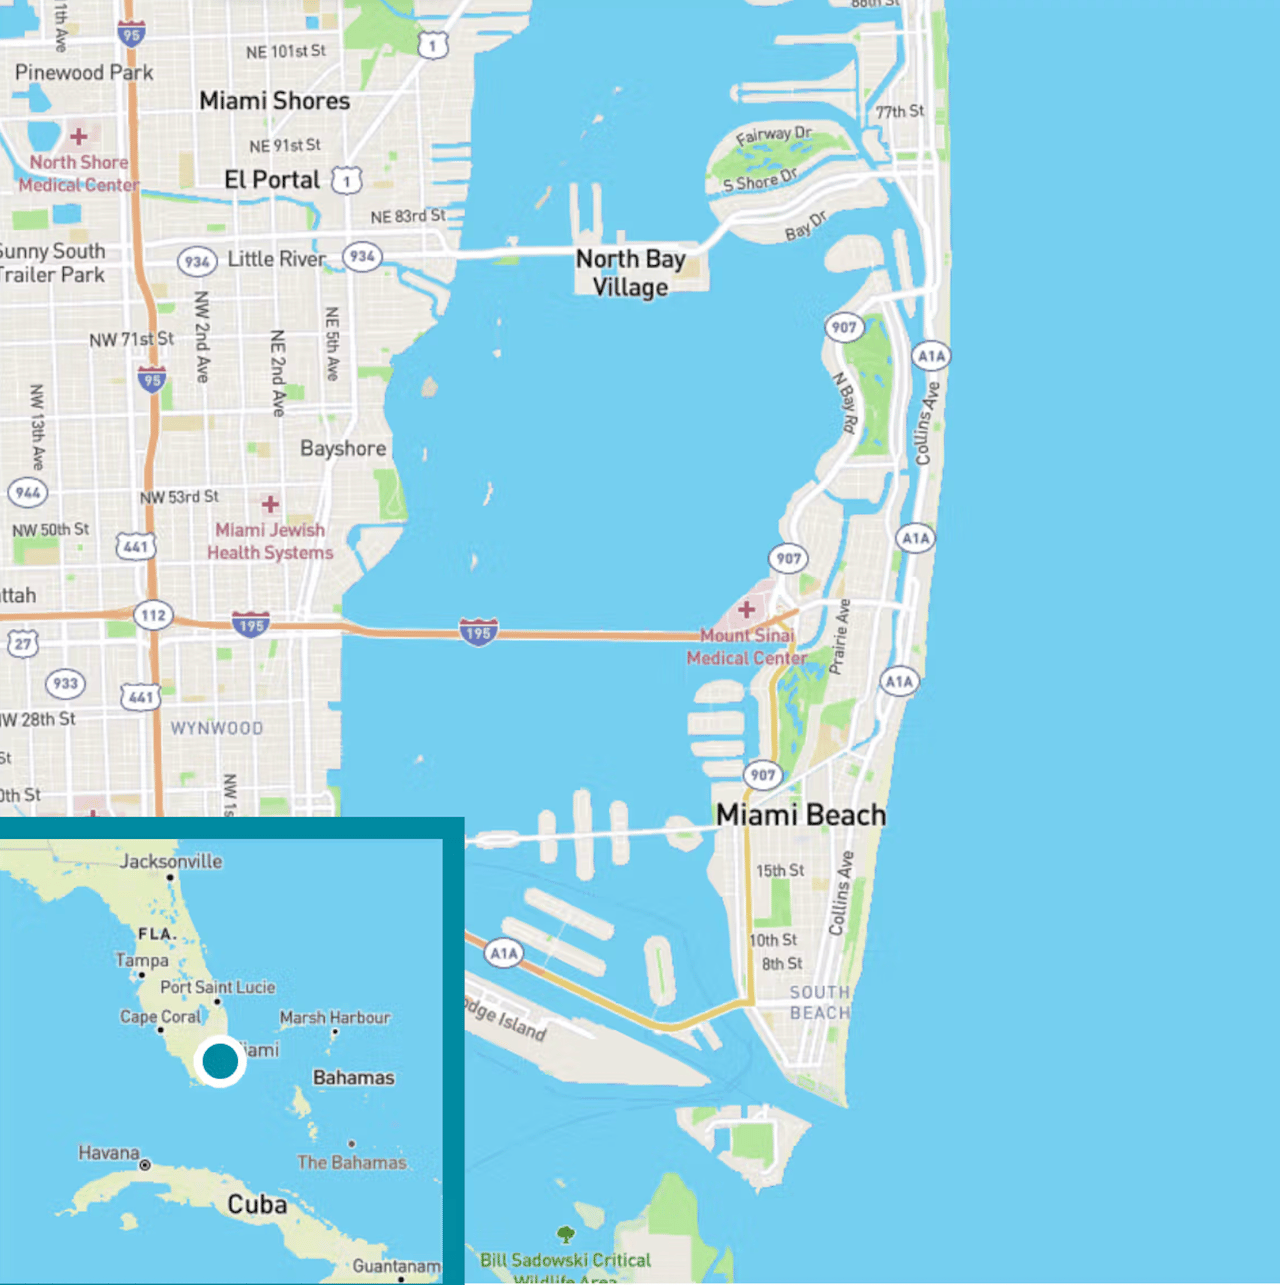
The Local Lowdown — Miami-Dade, Broward, and Orange Counties
-
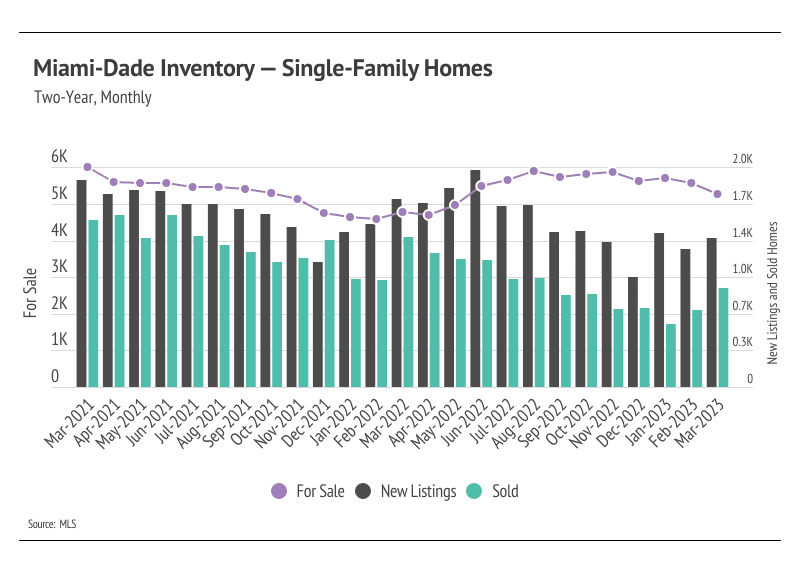
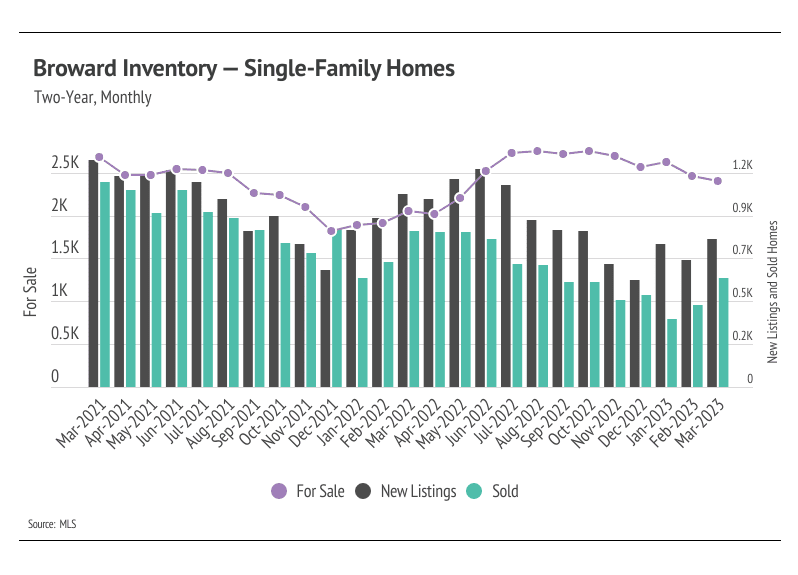
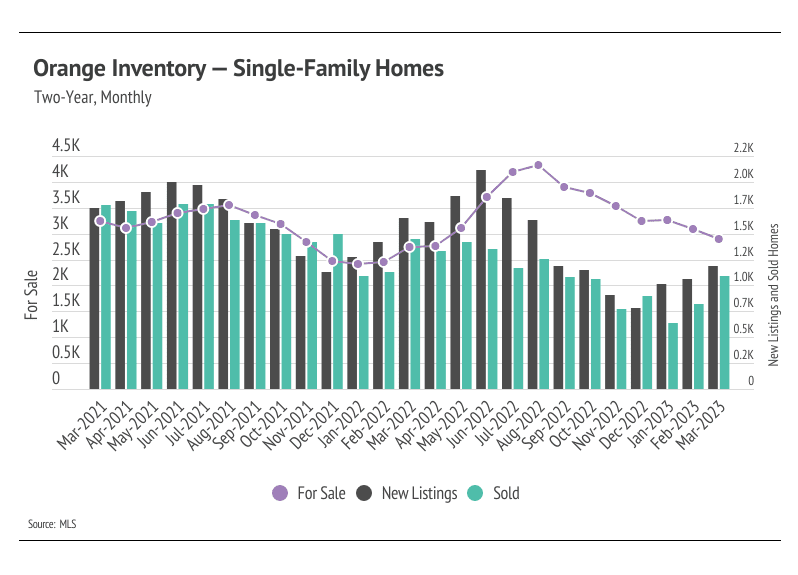
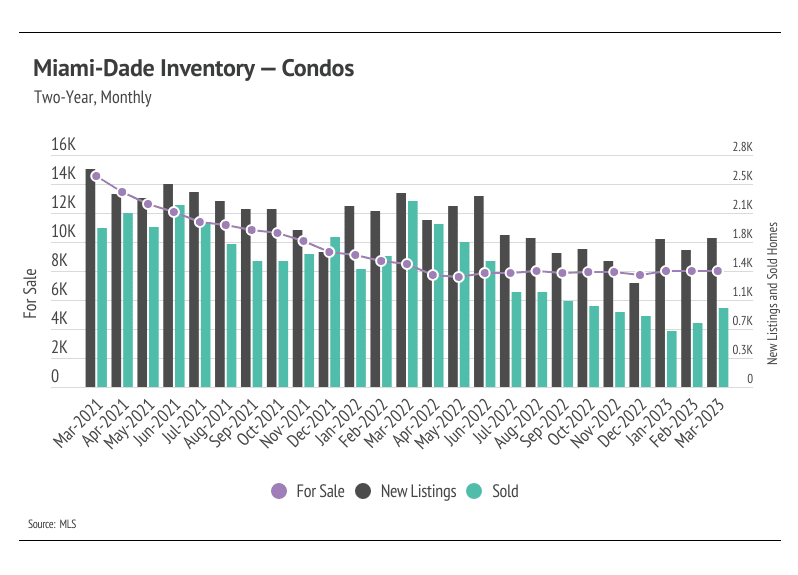
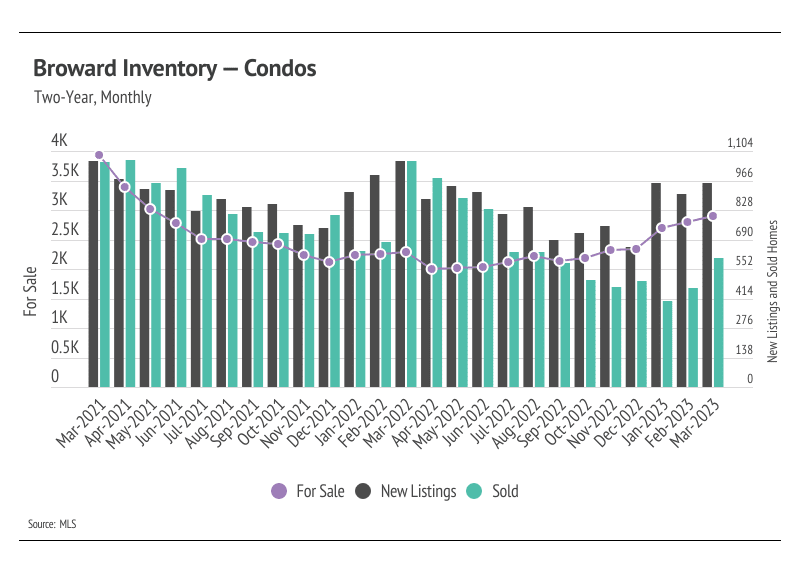
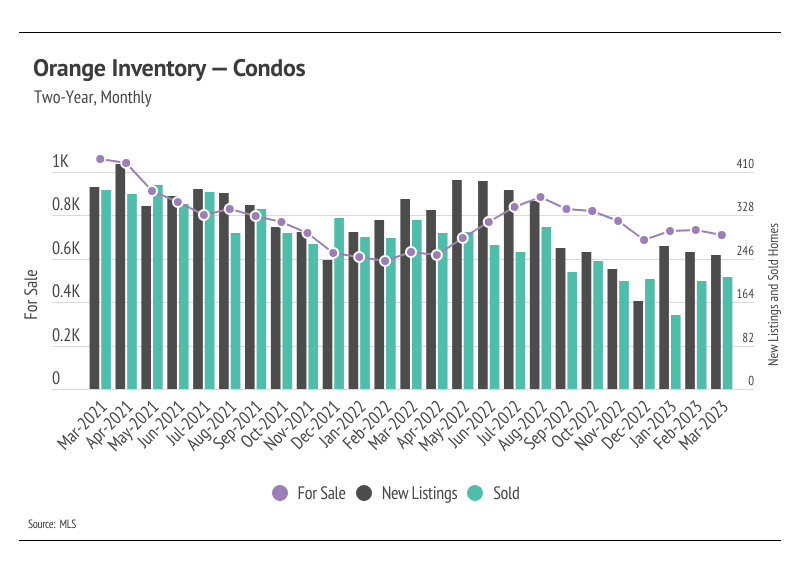
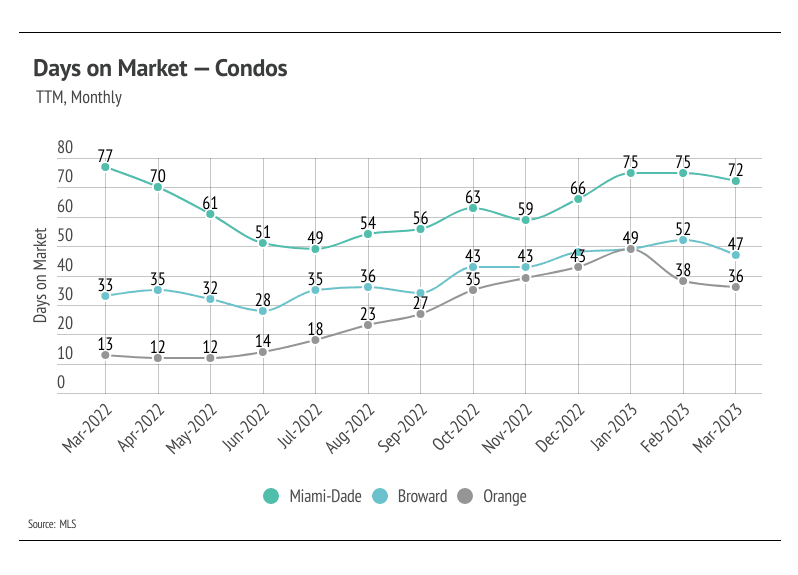
Active listings in the selected Florida markets declined further in March, except for Broward County condos, as sales increased and fewer listings came to market.
-
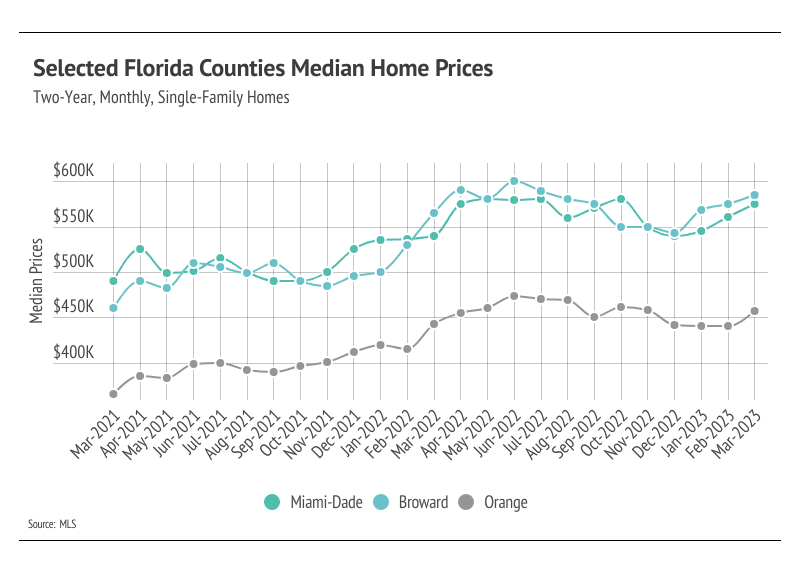
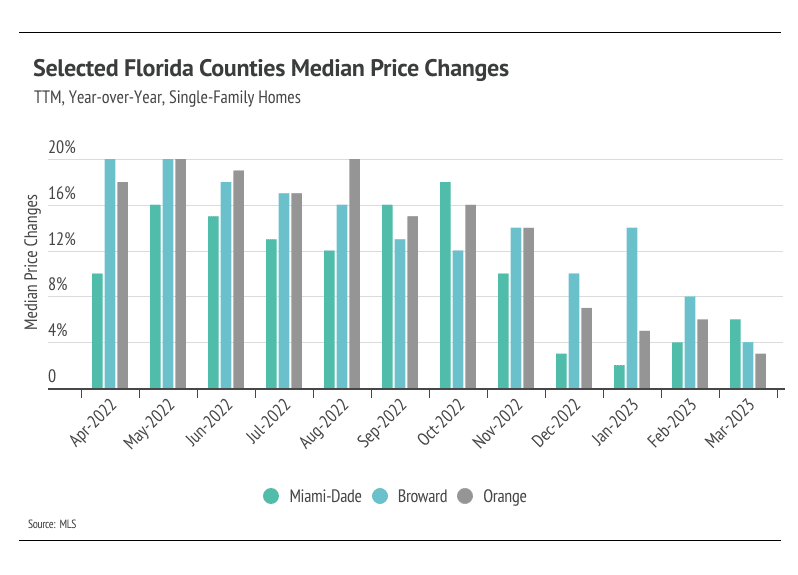
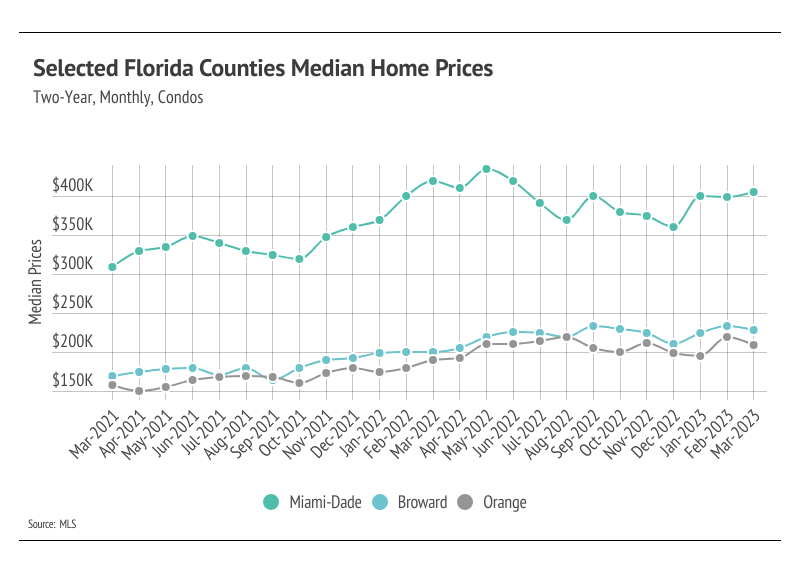
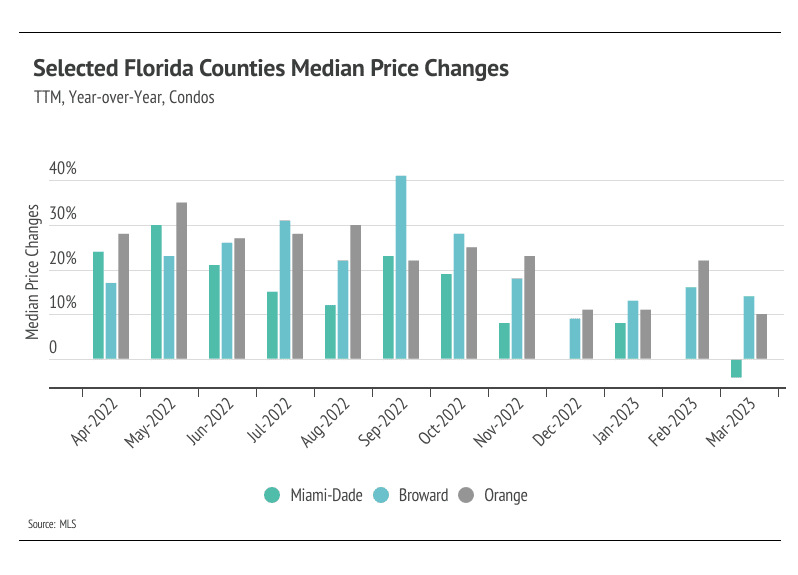
Single-family home and condo prices rose in the selected Florida counties in the first quarter of 2023, indicating that unusually low inventory is once again driving pricing despite higher mortgage rates.
-
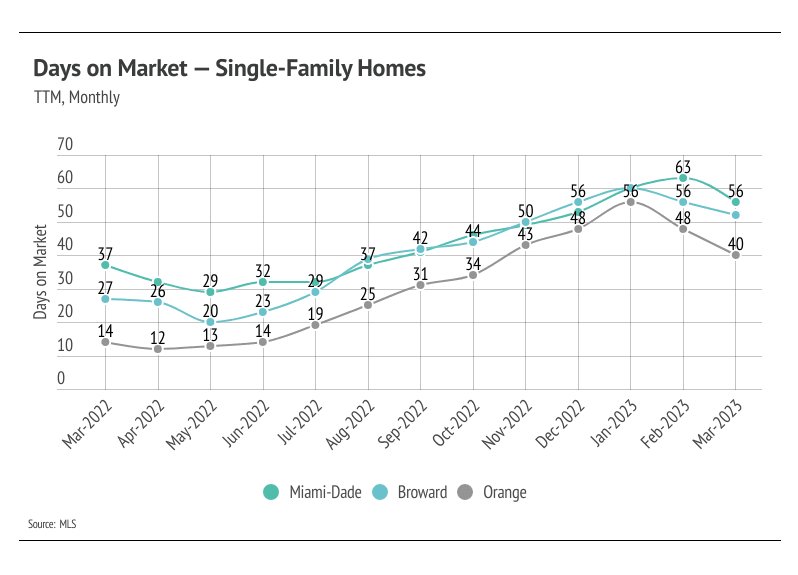
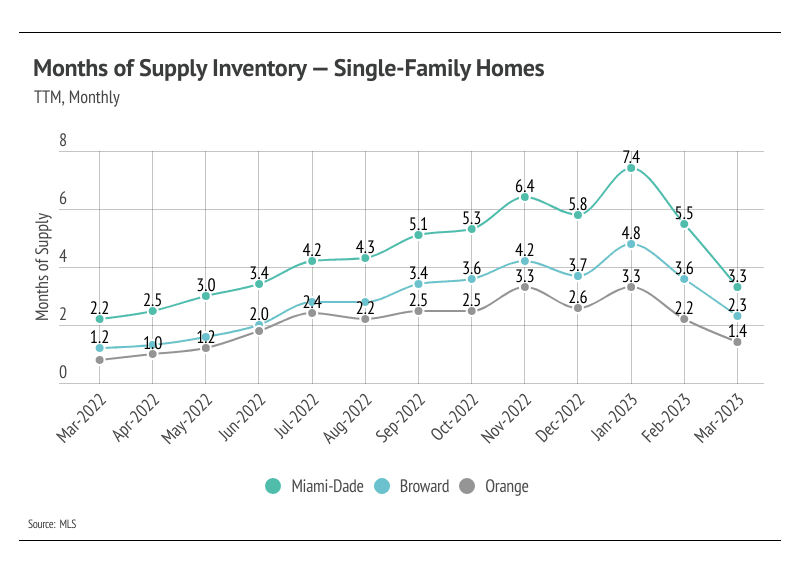
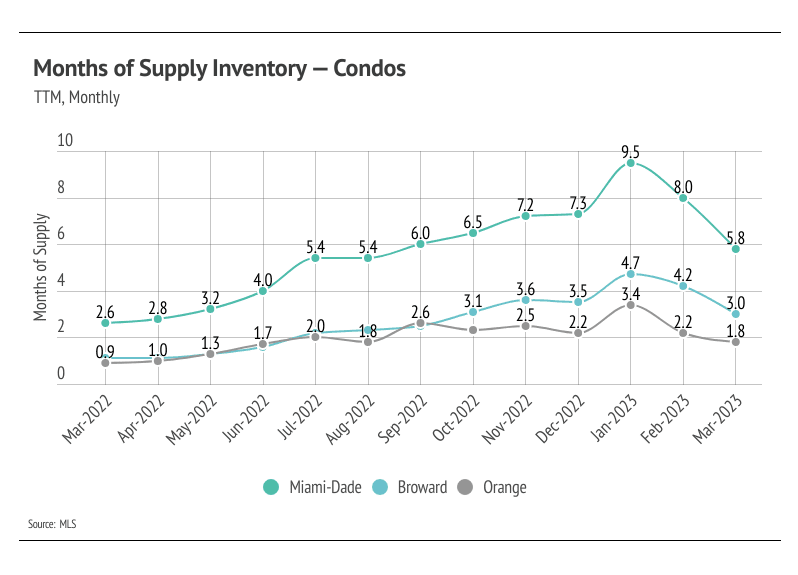
The housing market favors sellers except with Miami-Dade condos after Months of Supply Inventory declined sharply, as sales increased and homes sold faster month over month.
Note: You can find the charts/graphs for the Local Lowdown at the end of this section.
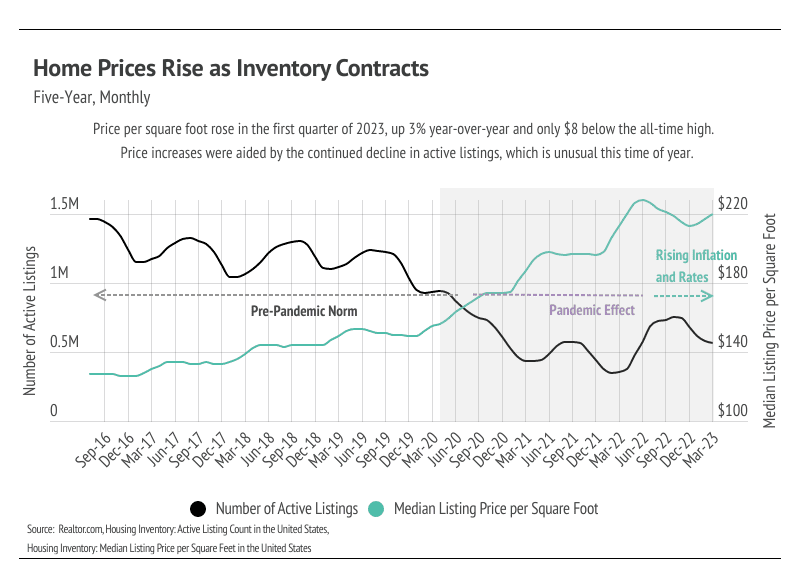
Declining inventory meets rising demand
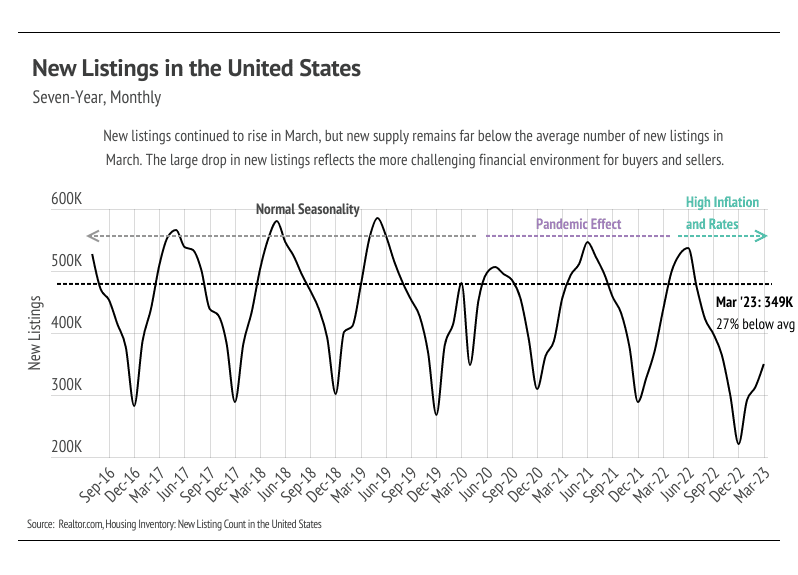
Every year, by at least March, we expect to see inventory rise after a high number of new listings come to market, which easily accommodate the increase in sales we also tend to see in the first half of the year. However, this year, the number of new listings weren’t enough to offset rising sales in the first quarter. Typically, inventory grows in the first half of the year, peaking in June or July. We don’t anticipate the inventory growth in the second quarter to make up for the decline in the first quarter, keeping supply of homes and, in turn, sales historically low for the rest of the year. Even with sales trending higher, they are still far below last year’s level. As demand increases in the second quarter, competition among buyers and housing prices will climb with it. Single-family-home and condo prices are just below their record highs. If active listings drop further in the second quarter, we could easily see home prices reaching new record highs in the summer.
Sales jumped 37% from February to March
Inventory continued to decline, except forBroward County condo inventory. Higher interest rates and the buying boom from June 2020 to June 2022 created the current market conditions of low inventory, new listings, and sales. Homeowners generally aren’t buying and selling properties year after year; the median homeowner tenure is about 13 years, according to Redfin. It’s reasonable, therefore, to assume that if an outsized number of sales happen in a two year period, far fewer buyers and sellers will come to market in the year or two after that event. For homeowners that either bought or refinanced in 2020 or 2021 with historically low rates, the prospect of moving and financing at a much higher rate isn’t appealing.
Interest rates have been elevated for enough time that buyers are more comfortable re-entering desirable markets like those in the selected counties. Sales jumped 37.1% from February to March, while new listings rose 11.0%. Buyers aren’t facing anything similar to the hypercompetitive 2021 market, but competition is certainly ramping up. New listings fell by 31.5% year over year, while sales declined 31.5%. We still expect some inventory growth in the second quarter of 2023, but inventory and sales will almost certainly remain low for the year.
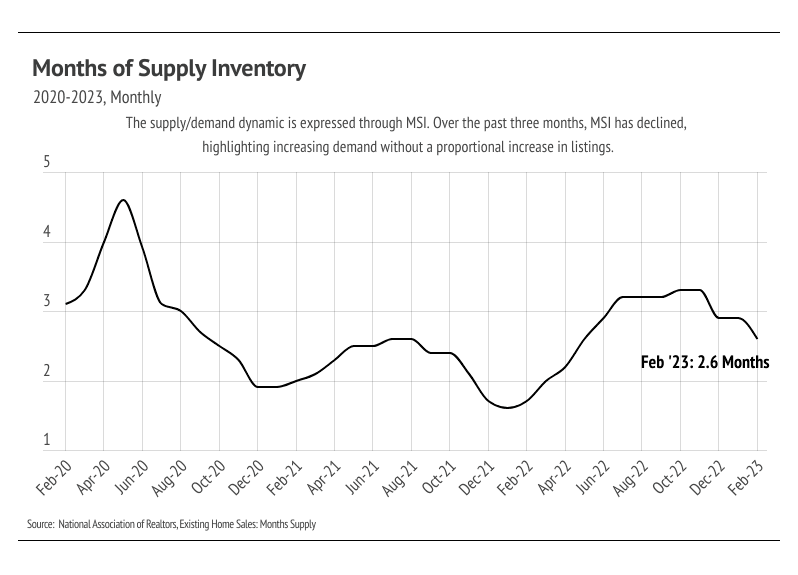
Higher sales drop Months of Supply Inventory, indicating a market shift
Months of Supply Inventory (MSI) quantifies the supply/demand relationship by measuring how many months it would take for all current homes listed on the market to sell at the current rate of sales. The long-term average MSI is around four to five months in Florida, which indicates a balanced market. An MSI lower than four indicates that there are more buyers than sellers on the market (meaning it’s a sellers’ market), while an MSI higher than five indicates there are more sellers than buyers (meaning it’s a buyers’ market). MSI dropped significantly in February and March, indicating a market shift in sellers favor. MSI for single-family homes suggests a sellers’ market in all the selected markets, while condo MSI signifies a sellers’ market in Broward and Orange Counties and a buyers’ market in Miami-Dade County.